A 40-step cost workflow, cut to 10, and trust in the numbers followed.
Task success rate in usability testing, above the 80% benchmark.
User satisfaction score, alongside a 4.3/5 usability rating.
Reduction in process complexity, from 40 steps to 10.
Project Overview
Project Overview
The user problem
Users managing cloud costs relied on a generic resource-tagging system spread across three separate services. Access-permission gaps locked out non-technical personas like Finance, the process itself ran to roughly 40 steps, and incorrectly tagged resources produced misleading cost data that teams couldn't trust.
The business objective
Remove the barriers stopping customers from realizing the platform's cost-management value: consolidate a disjointed, 40-step tagging workflow into a single, centralized experience that every persona could use, lifting activation and reducing the churn tied to lost trust in cost data.
My role and scale of ownership
I led the redesign of this cloud cost management service collaborating with PM and research on competitor analysis, generative research with internal experts and clients, then led information architecture, user flows, wireframes, mockups and prototypes, through to the usability testing that validated the concept before handover to engineering.
How I got from insights to product value
Discover
- 6 interviews and contextual inquiries surfaced real usage patterns and pain points.
- A full audit of the existing 40-step, three-service flow showed where users hit confusion or abandoned tasks.
Define
- Designed a new cost-categories subsection's information architecture, integrated natively into the existing billing and cost management service.
- Mapped the original 40-step journey and redesigned it down to 10 steps, a 75% reduction, without losing any critical functionality.
Design
- Elevated wireframes to mockups in the design system's language, covering CSV upload, rule builder and code creation paths.
- Prototyped the flows and ran usability testing that confirmed the IA and multi-path creation model matched users' mental models.
Deliver
- Resolved usability findings (confusing terminology, unclear inactive states, retroactive-edit indicators) before handover.
- Delivered a fully specified design to engineering, cutting the 40-step journey down to 10 steps.




Execution
Execution
Building alignment before building screens
The project opened with a review of existing documentation and a kickoff workshop to capture stakeholder requirements firsthand. From there I developed a focused problem statement, synthesized existing user insights from prior customer research, established the primary personas, and defined the core use cases and feature requirements the rest of the work would test against.

Discovery diagram mapping the cost-category problem space.





- Finance users to configure cost categories without engineering
- Technical admins to configure resources at scale, e.g. migrations
- One central place for cost management vs 3 scattered services
- Configure costs without learning IAM
- Reallocate costs retroactively when tagged to the wrong cost centre
- Merge cost categories across tenancies
- Bulk tag compartments and resource groups
- Allocate shared costs accurately
- Organise cost categories by product
Planning the work
I developed a comprehensive UX plan and collaborated with product and engineering teams to secure alignment and approval for the proposed activities and timelines. The plan encompassed critical deliverables such as completing user personas for future research initiatives and conducting use case and scenario analysis.
It also covered establishing information architecture, creating user flow maps, and developing wireframes, mockups, and interactive prototypes, plus usability testing phases, ongoing design iteration cycles, and the delivery of finalized components to support development and launch efforts.
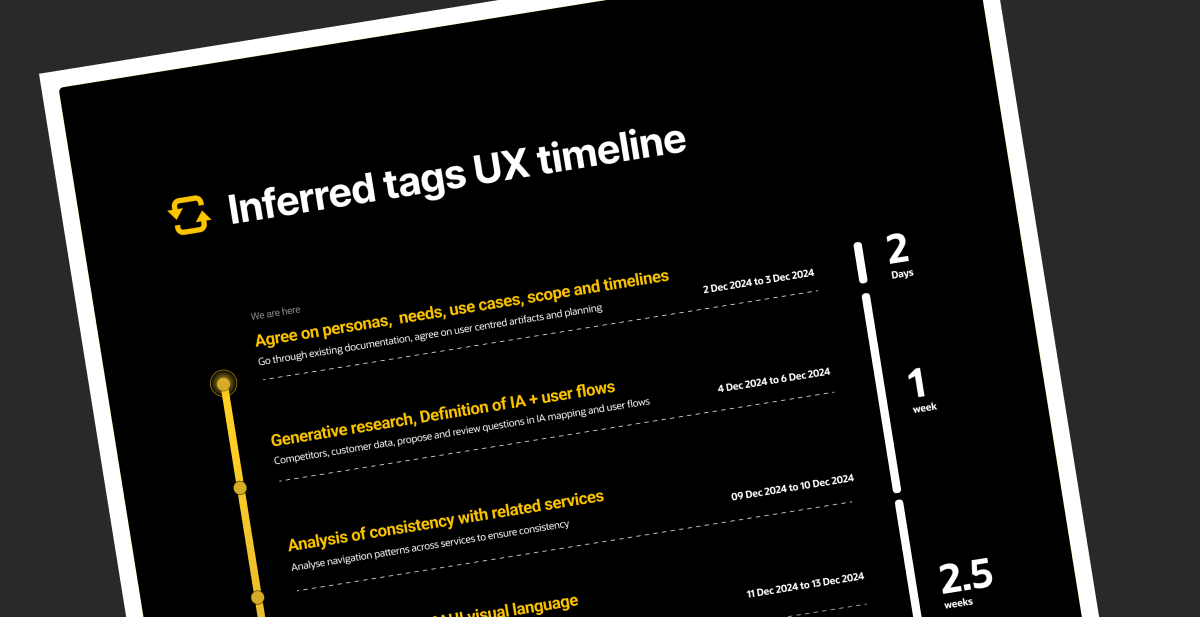
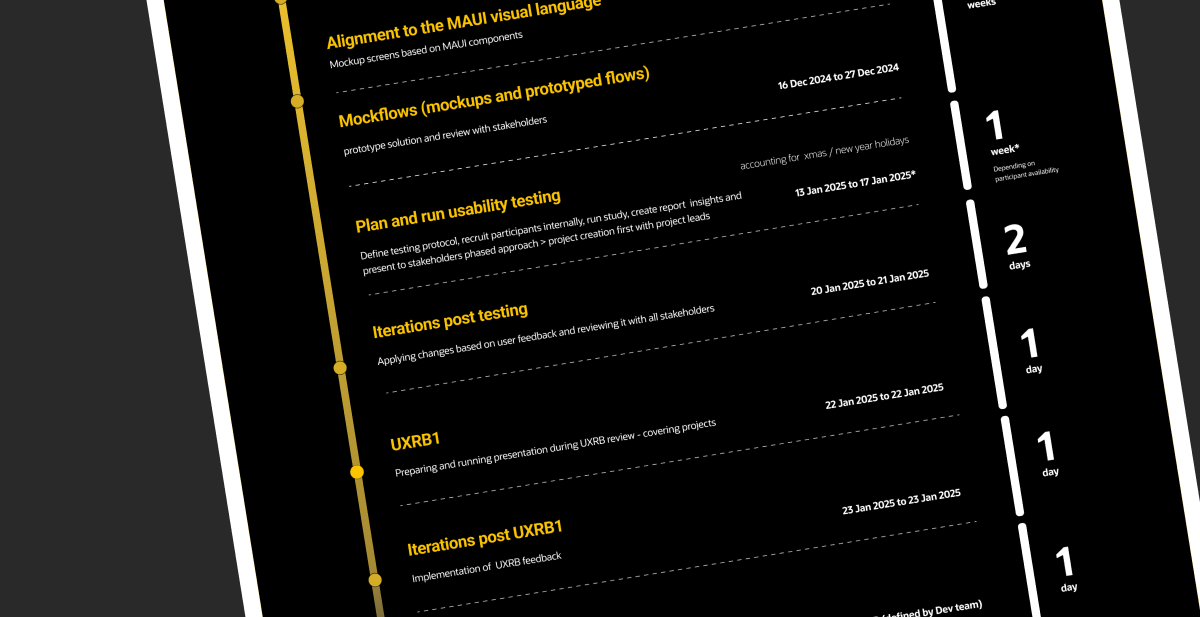
The UX plan aligning product and engineering on activities and timelines.
Researching the market
A competitive analysis of four primary competitors examined their information architecture, interaction patterns, journeys and terminology, surfacing industry-standard conventions like "cost categories" as the common term and a split between manual logic statements and automation-first patterns.
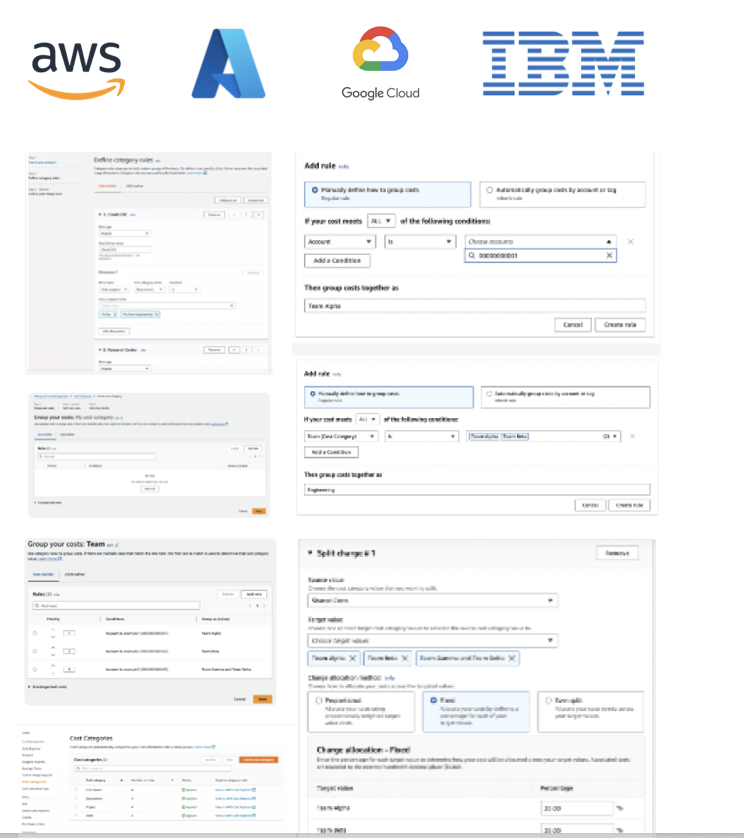
Competitor analysis across four primary market players.
Main market findings
| Terminology | "Cost categories" is the industry-standard term across the four competitors analysed. |
| Configuration model | A split between manual logic statements and automation-first patterns across the market. |
| Information architecture | Competitors consistently place cost categorisation within billing and cost management, not as a standalone service. |
| Interaction patterns | Journeys favour bulk actions and rule-based tagging over one-resource-at-a-time edits. Ability to group per team; lists and logic statements are the main patterns. |
Researching real usage
6 Interviews and contextual inquiries took place (1 expert internal user interview + 5 client interviews/contextual inquiries). These sessions provided in-depth insights into user behaviors, workflows, and pain points within their natural environments.
This allowed me to observe how users actually interacted with existing tools and processes. The research revealed critical user needs and challenges that informed our understanding of potential solutions, helping to validate assumptions and uncover opportunities for improving the user experience in real-world contexts.
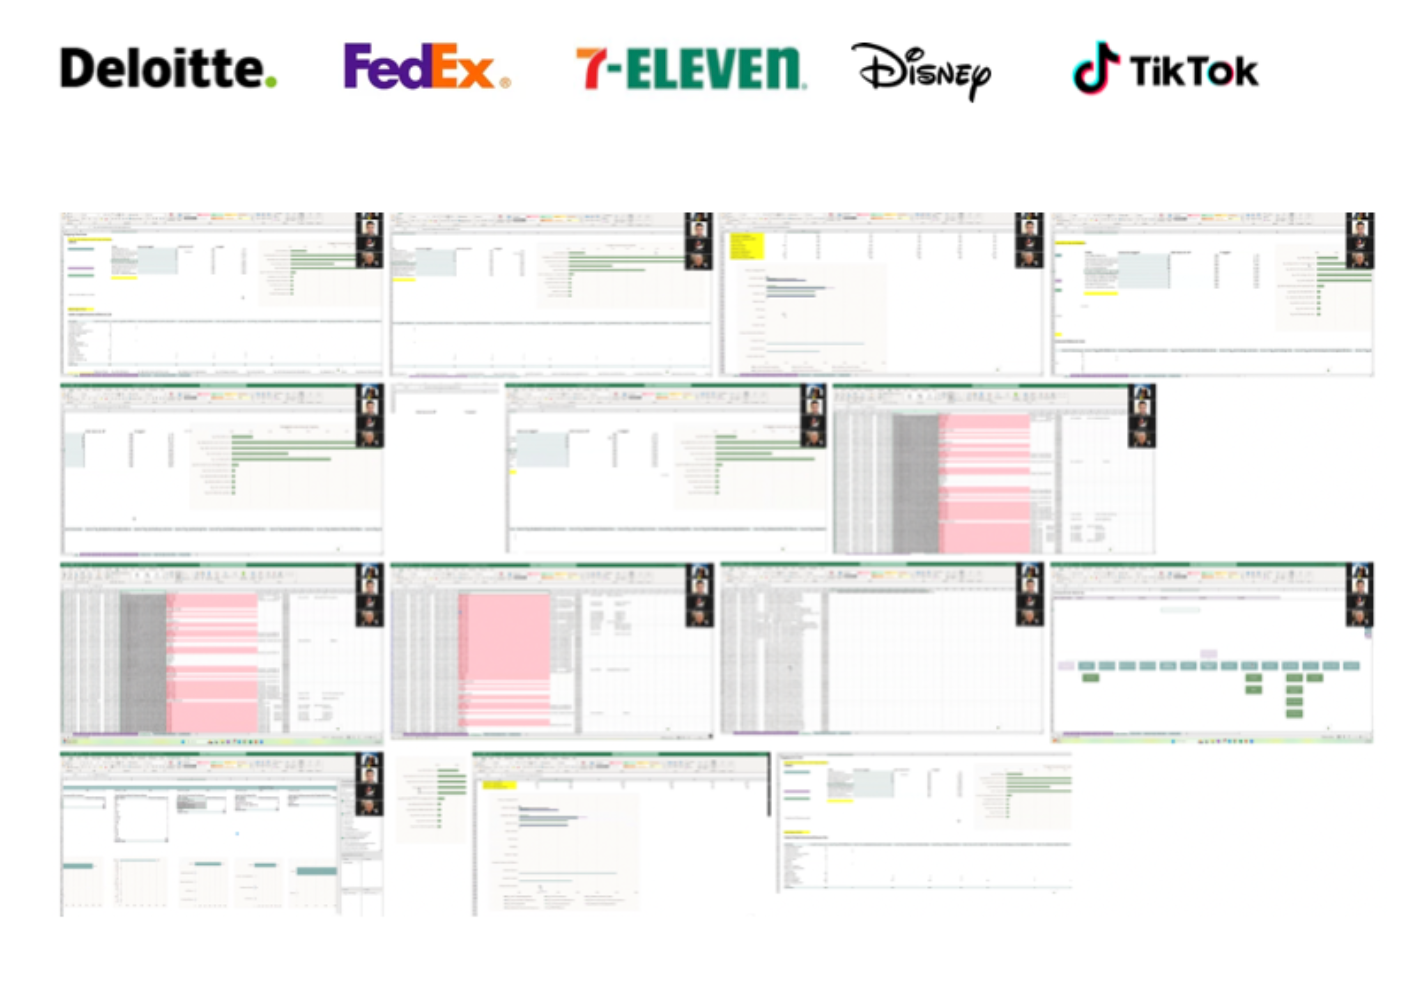
Summary of findings from expert interviews and client contextual inquiries.
Main user findings
Lack of automation.
Low tag-feature usage, under 8%.
Need to retroactively change costs.
Excel used for planning by Finance users.
Desire for anticipatory naming suggestions.
Often loose configuration, requiring rework.
Access-right restrictions to console and features.
Need to bulk-tag (same rule across 400+ resources).
Custom code / Terraform tools used by cloud architects and engineers.
Need to classify costs based on compartment, tenancy and application name.
Auditing the current experience
I recorded the existing flow end to end, so the cost of every detour was visible before anything was redesigned.

The current experience: tagging spread across three separate services.
Redesigning the journey and information architecture
Mapping the existing experience made the scale of the problem concrete: roughly 40 steps spread across three disjointed services just to create a tag, associate it with resources and costs.
Keeping track of them, there was no way to bulk-tag or bulk-edit, and edits were only possible at the individual resource level.
The original 40-step journey was mapped in full, then consolidated by removing redundant steps and unnecessary navigation between services, cutting the process to 10 essential steps, a 75% reduction, while keeping every critical capability.
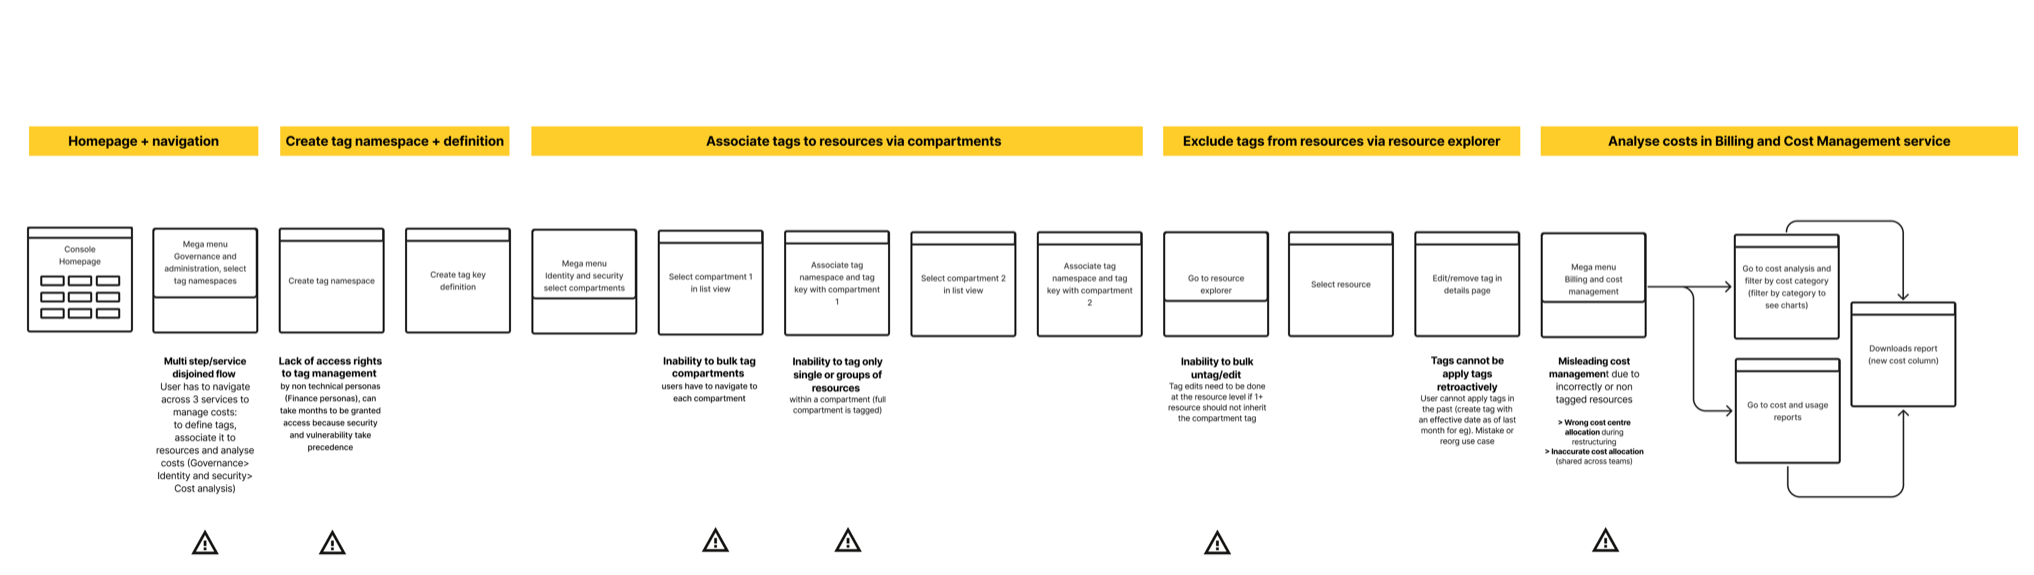
Original journey: 3 services, 40 steps.
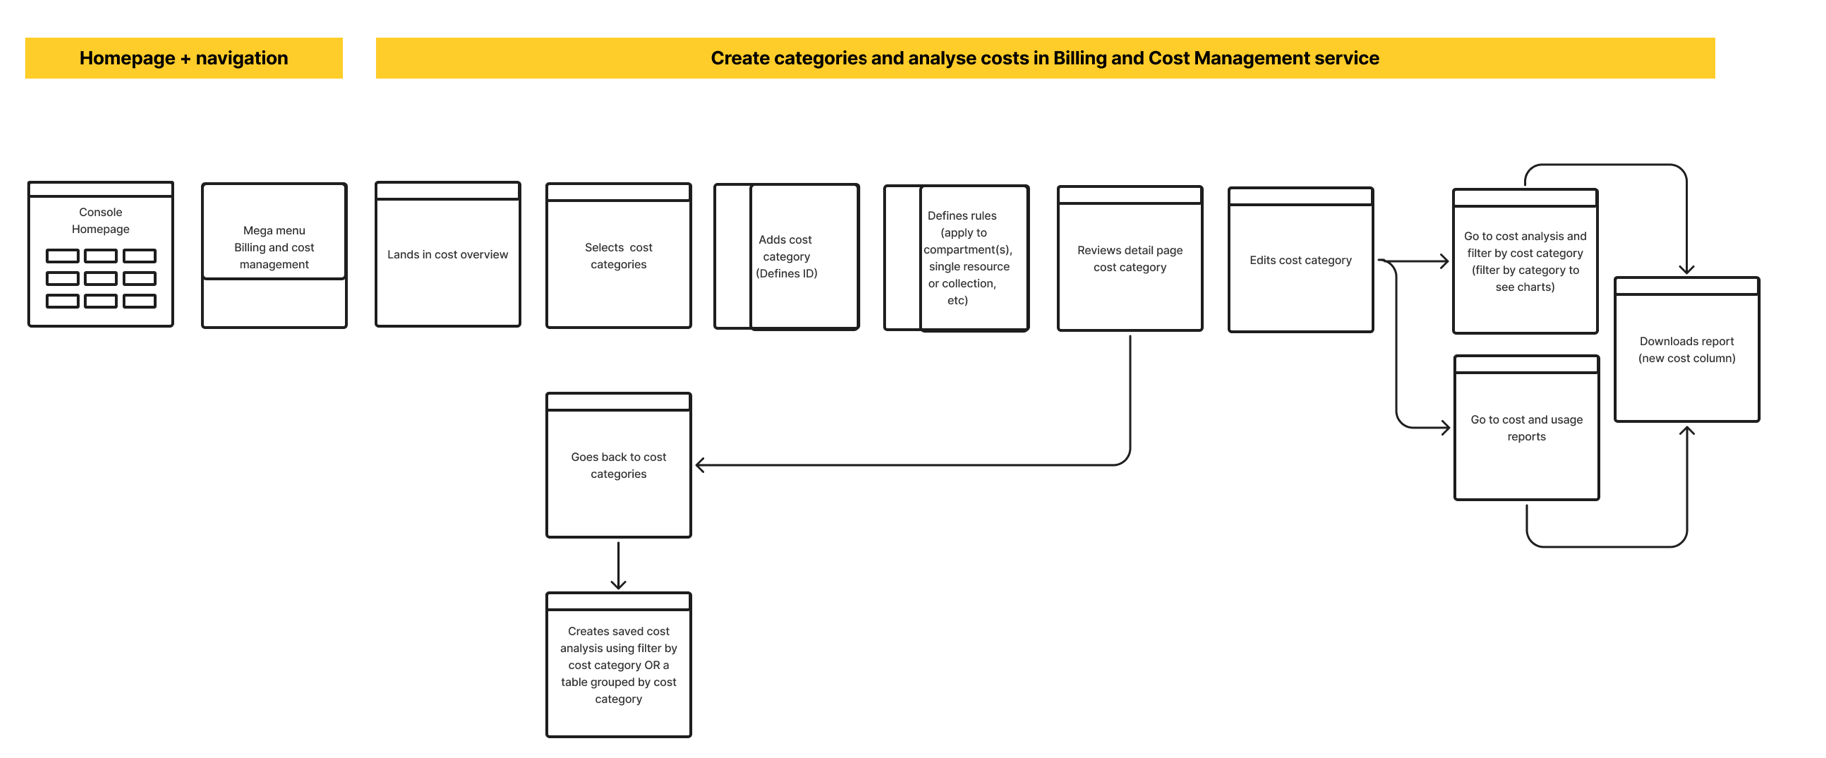
Proposed journey: 10 steps, 1 service, a 75% reduction.
Removing access barriers and reducing process complexity by 75%: original, 40 steps; new, 10 steps.
That new capability needed a home, so I designed a dedicated "cost categories" subsection within the existing billing and cost management service, mapping the full IA to confirm the new pages fit the product's existing structural logic before any screen was drawn.
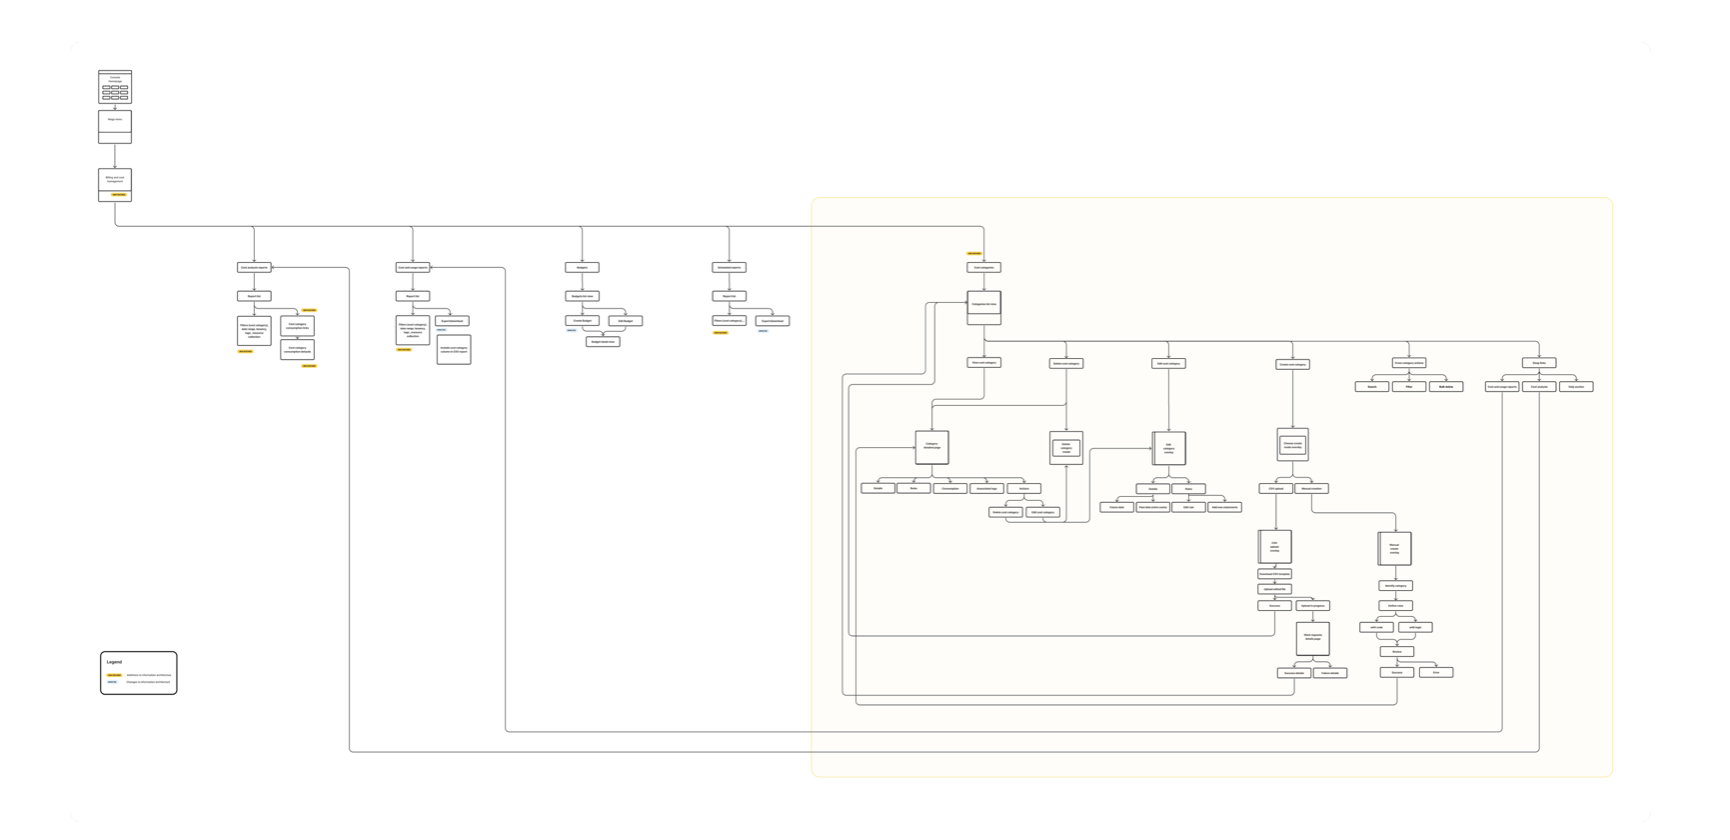
Billing and cost management IA, with the new cost-categories section highlighted.
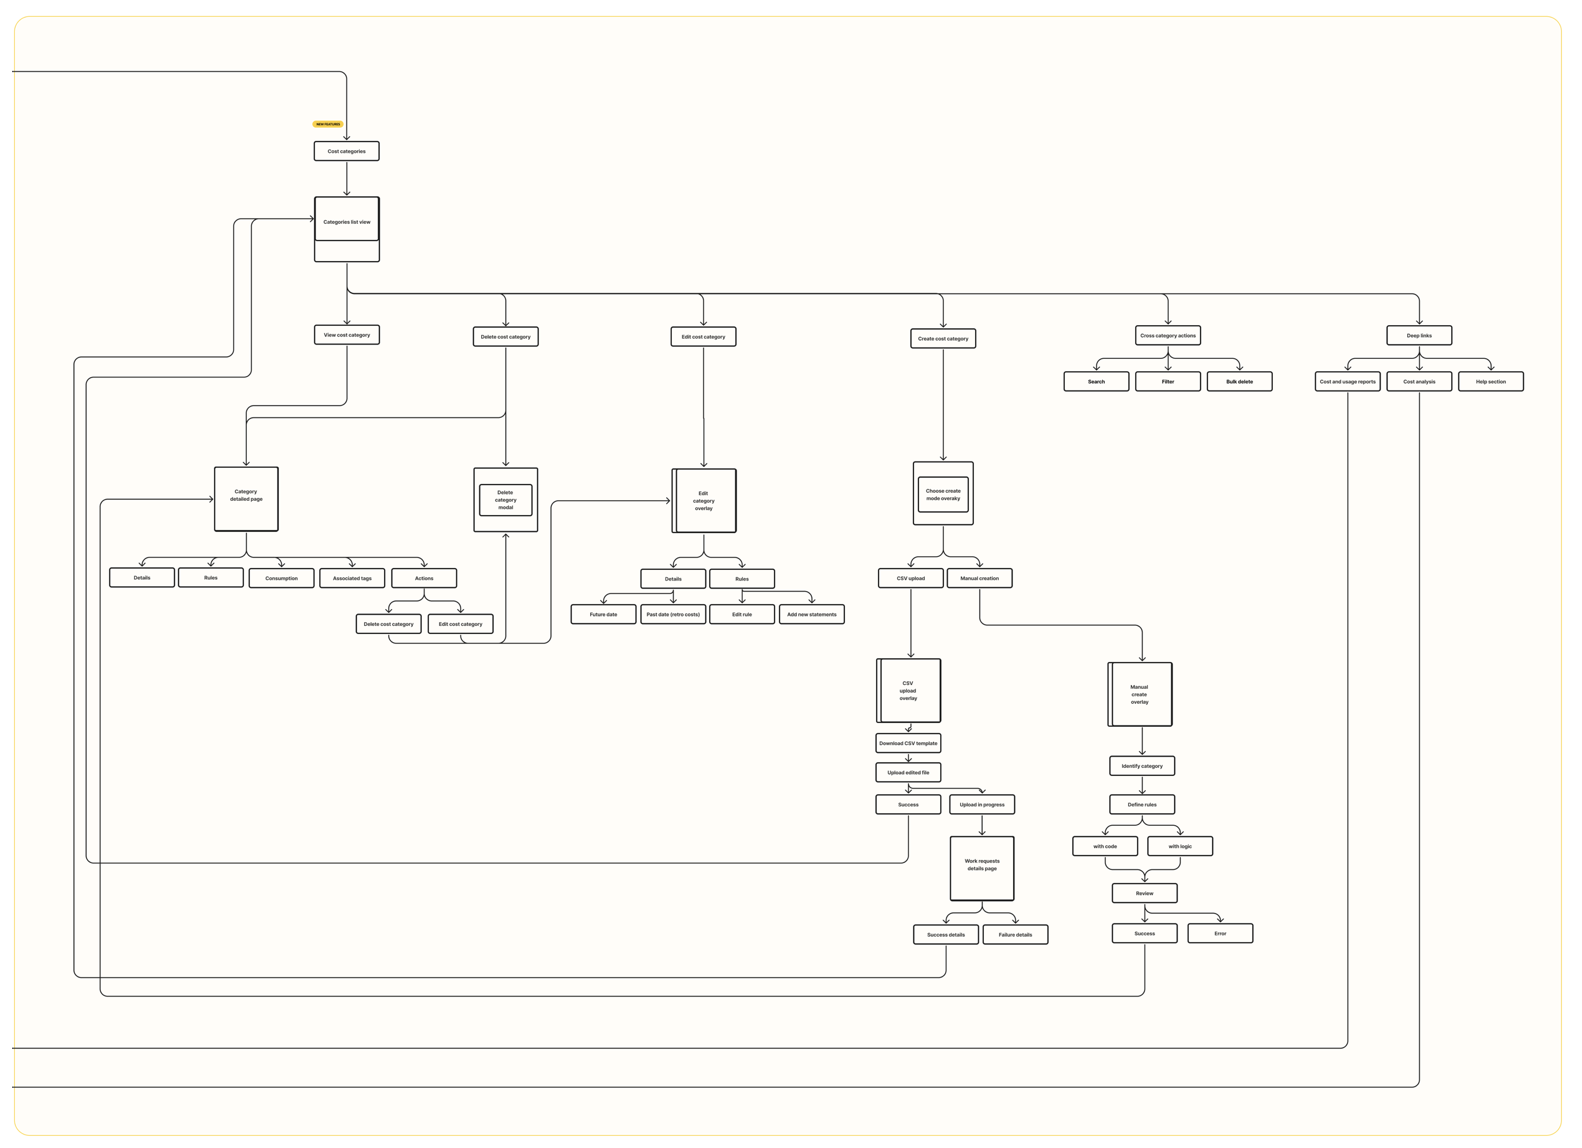
Cost categories section IA, zoomed in.
From wireframes to a validated design
I elevated wireframes to mockups in the design system's language and prototyped across scenarios covering four core use cases: bulk creation via CSV upload, manual creation through either a logic-based rule builder or a code syntax editor, ongoing management (create, read, update, delete, with a focus on retroactive edits), and a cost overview per category, giving every persona, from Finance to cloud architects, a path that matched how they actually worked.
Main use cases
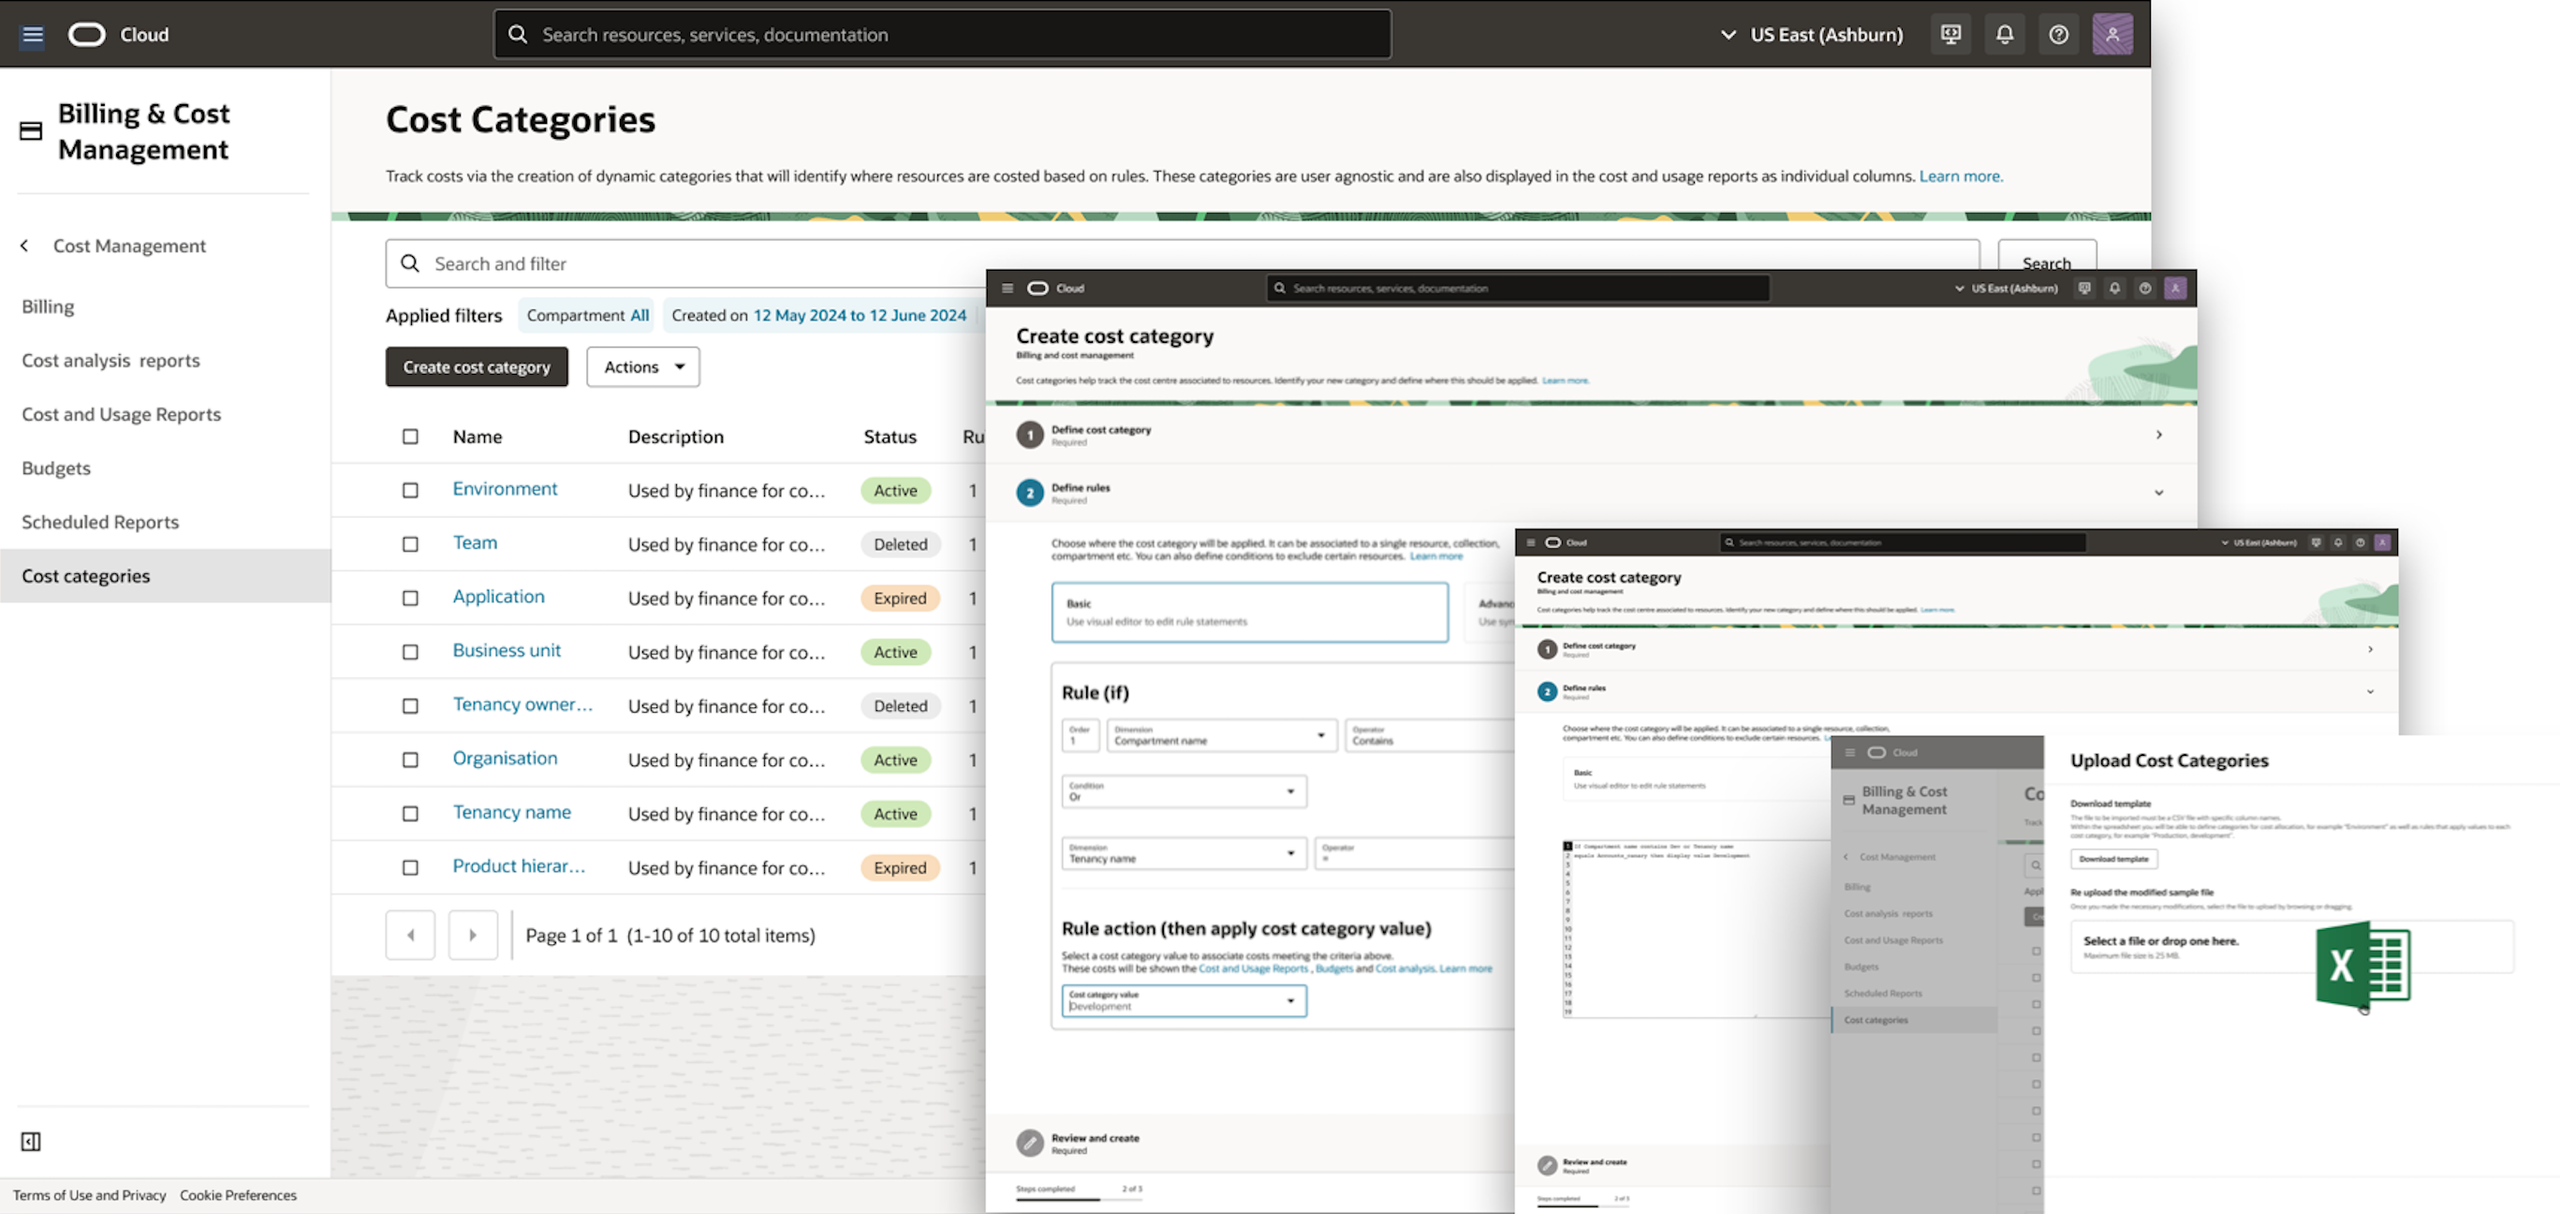
Create-category mockup, supporting CSV upload, rule builder and code.
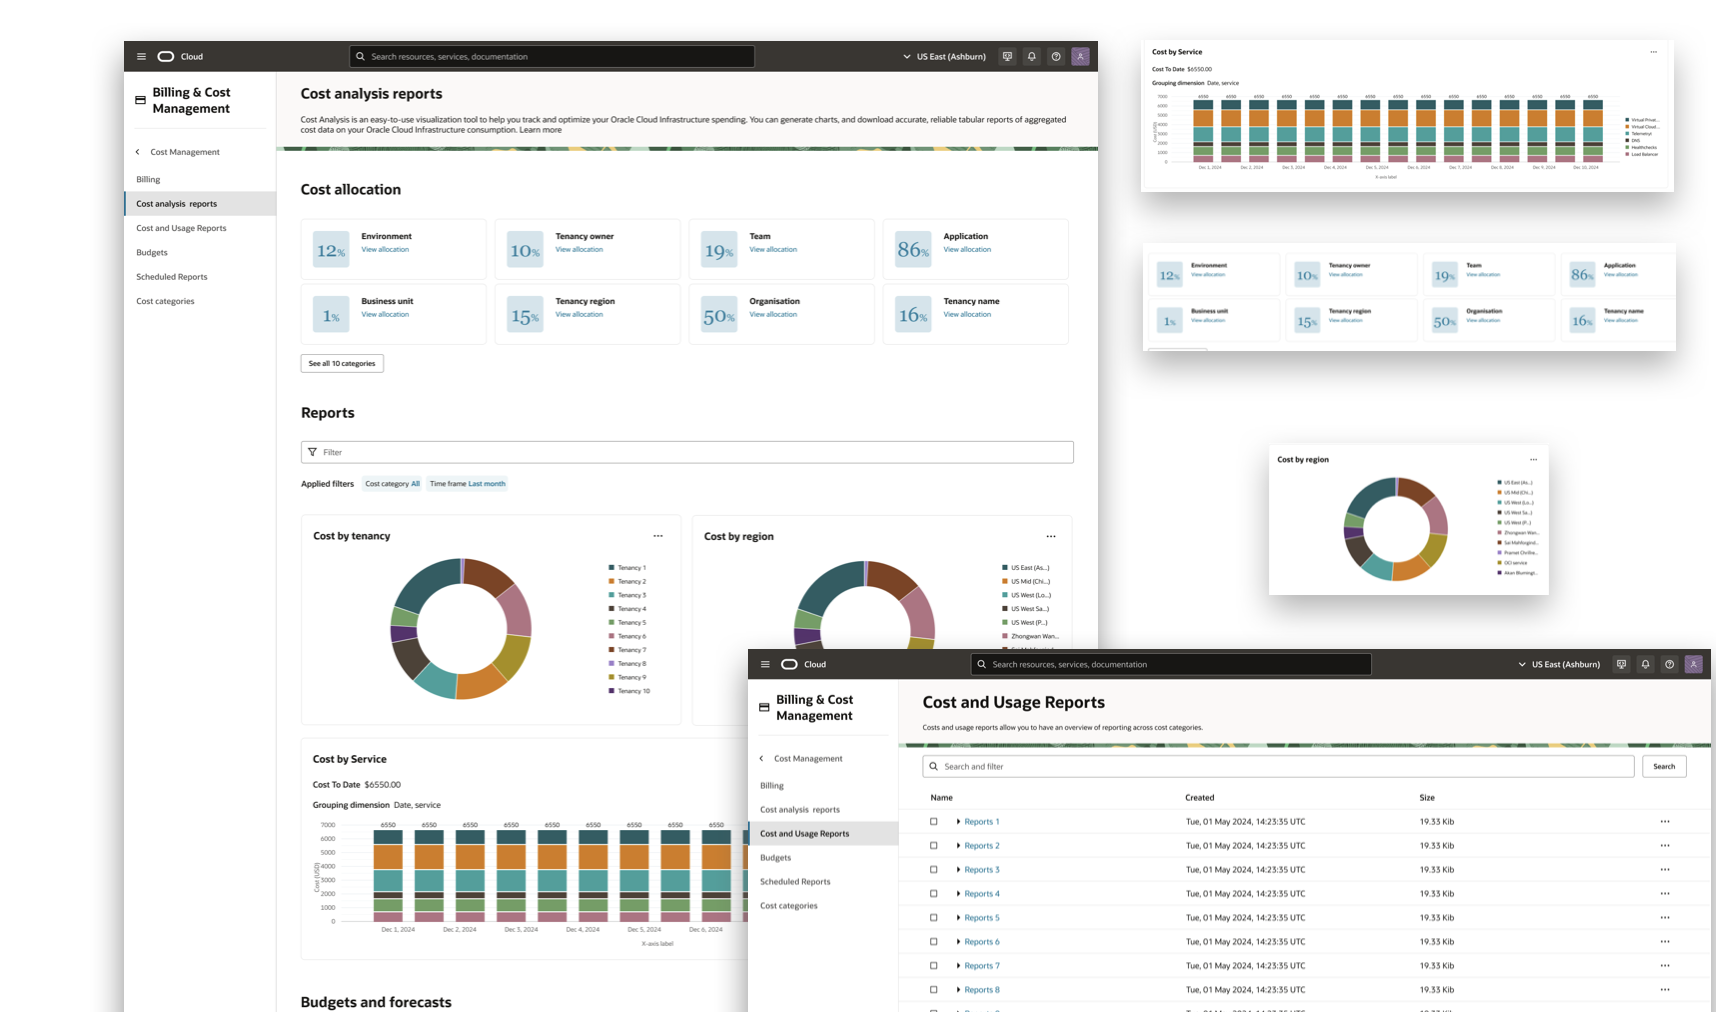
Manage view, with retroactive edits and per-category cost overview.
Bulk creation by CSV upload, straight from the cost-categories list.
Manual rule creation within the create-category flow.
Evaluating concepts with testing
Usability testing then confirmed the core hypothesis: the centralized IA and the multiple creation paths matched users' mental models, and participants completed tasks faster than on the original experience. Testing also surfaced targeted fixes, confusing terminology and placement around the "rule value" field, an inactive state that read as ambiguous, and a need for clearer retroactive-edit indicators, which were resolved before the design was handed to engineering.
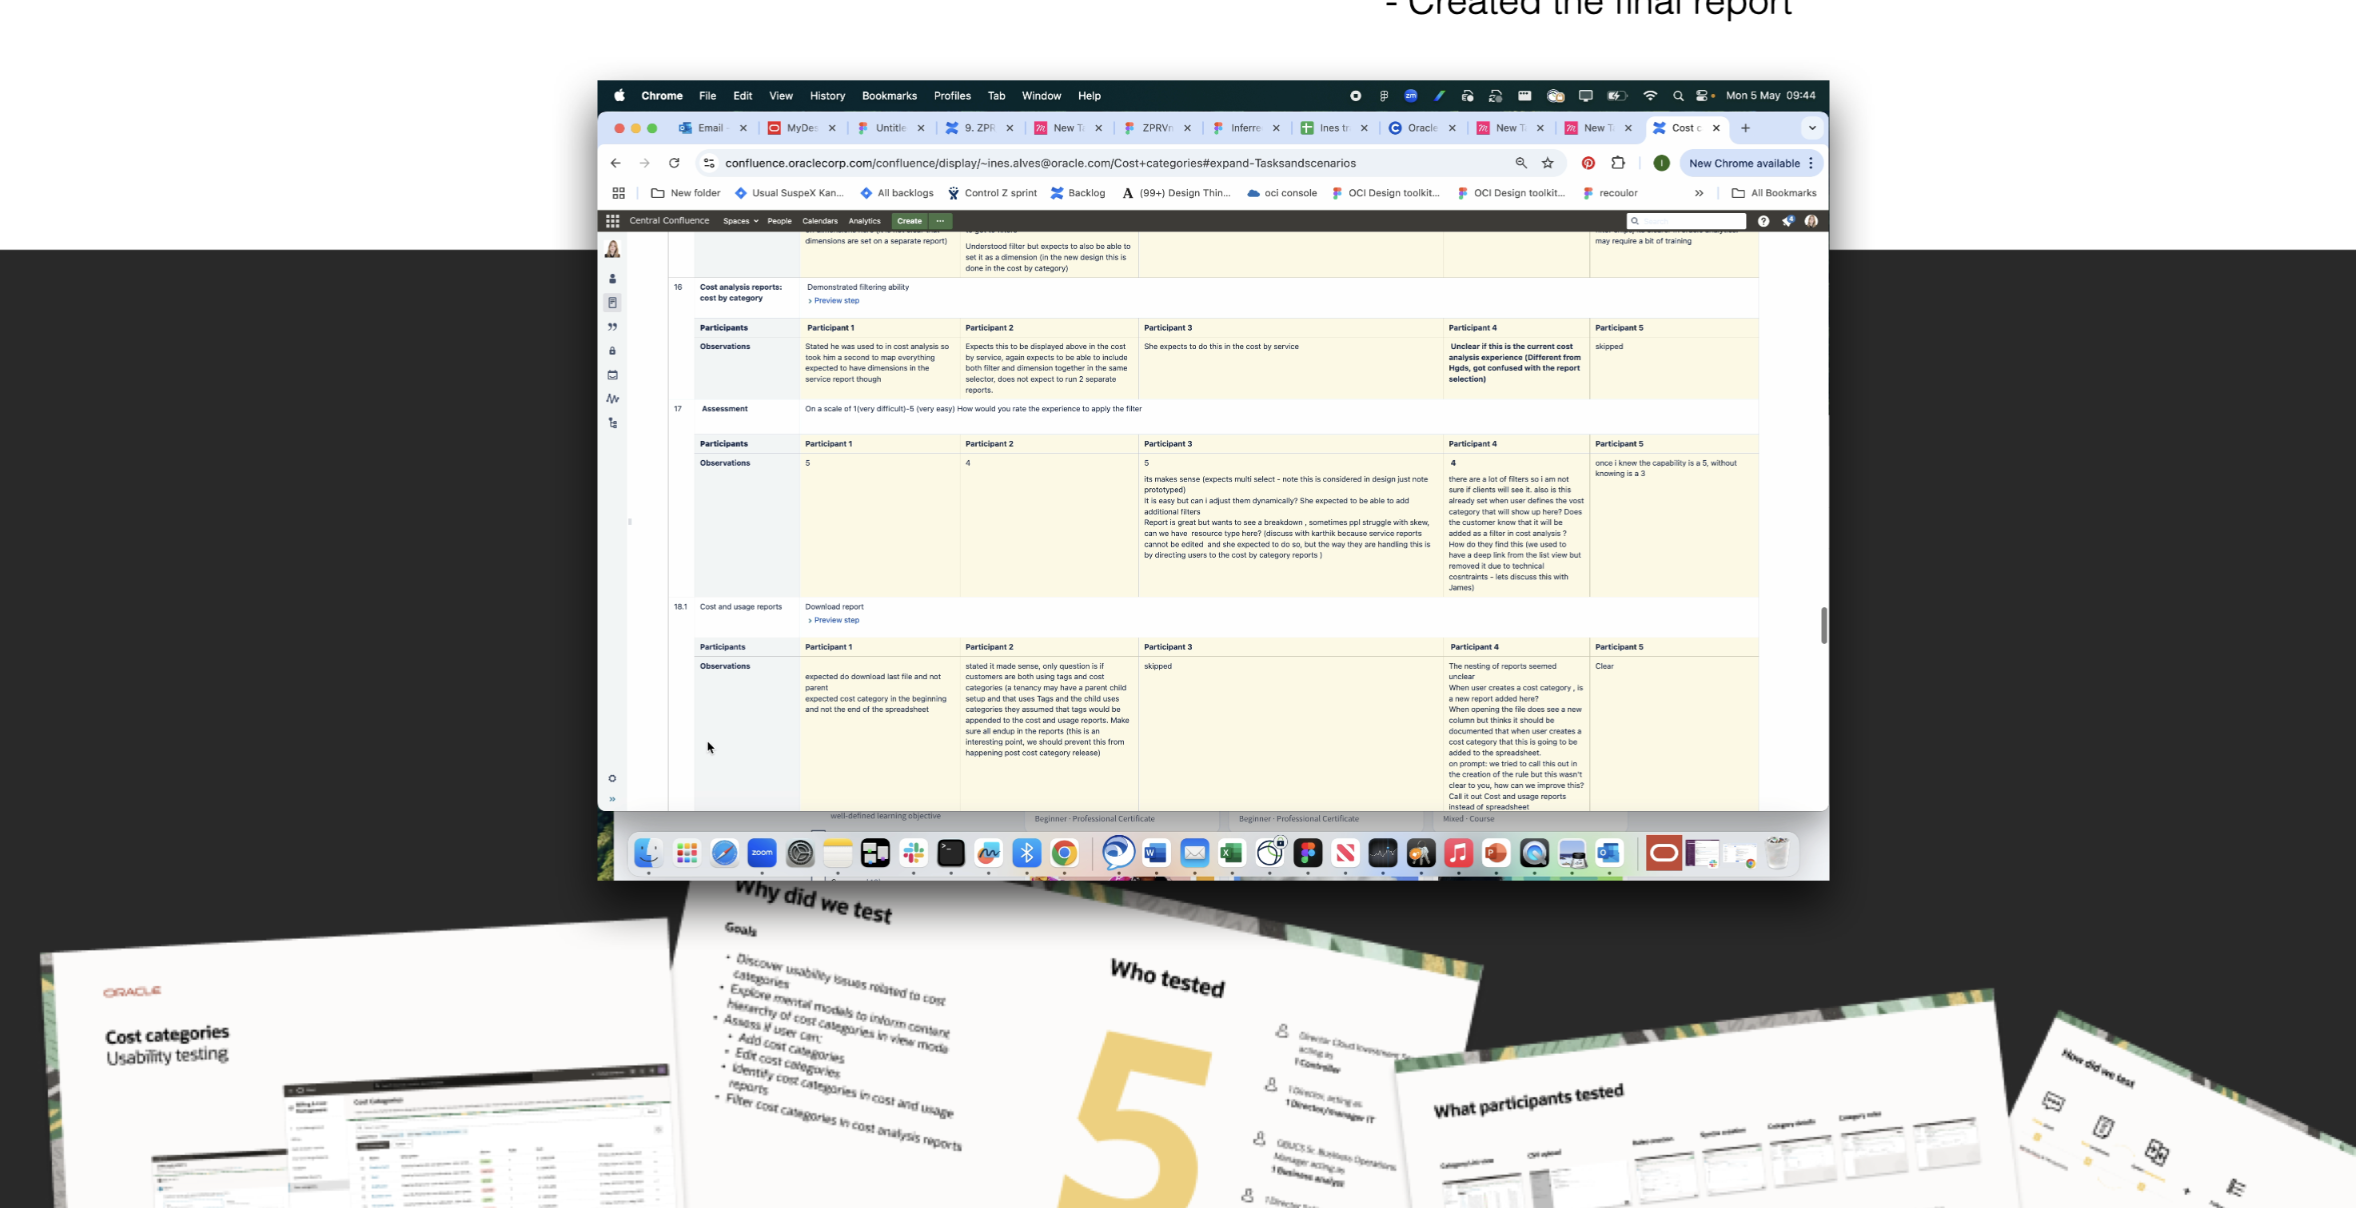
Usability testing sessions that validated the concept before handover.
List view findings from usability testing sessions.
Iterations post testing
Every finding was tracked back to the screen it affected and resolved before handover: terminology and placement of the "rule value" field, a clearer distinction between deleted and inactive categories, retroactive-edit indicators in the list, and combined filtering in the reports. The board below holds the annotated iterations across all six areas, from list view and both creation paths to the details page and reporting.
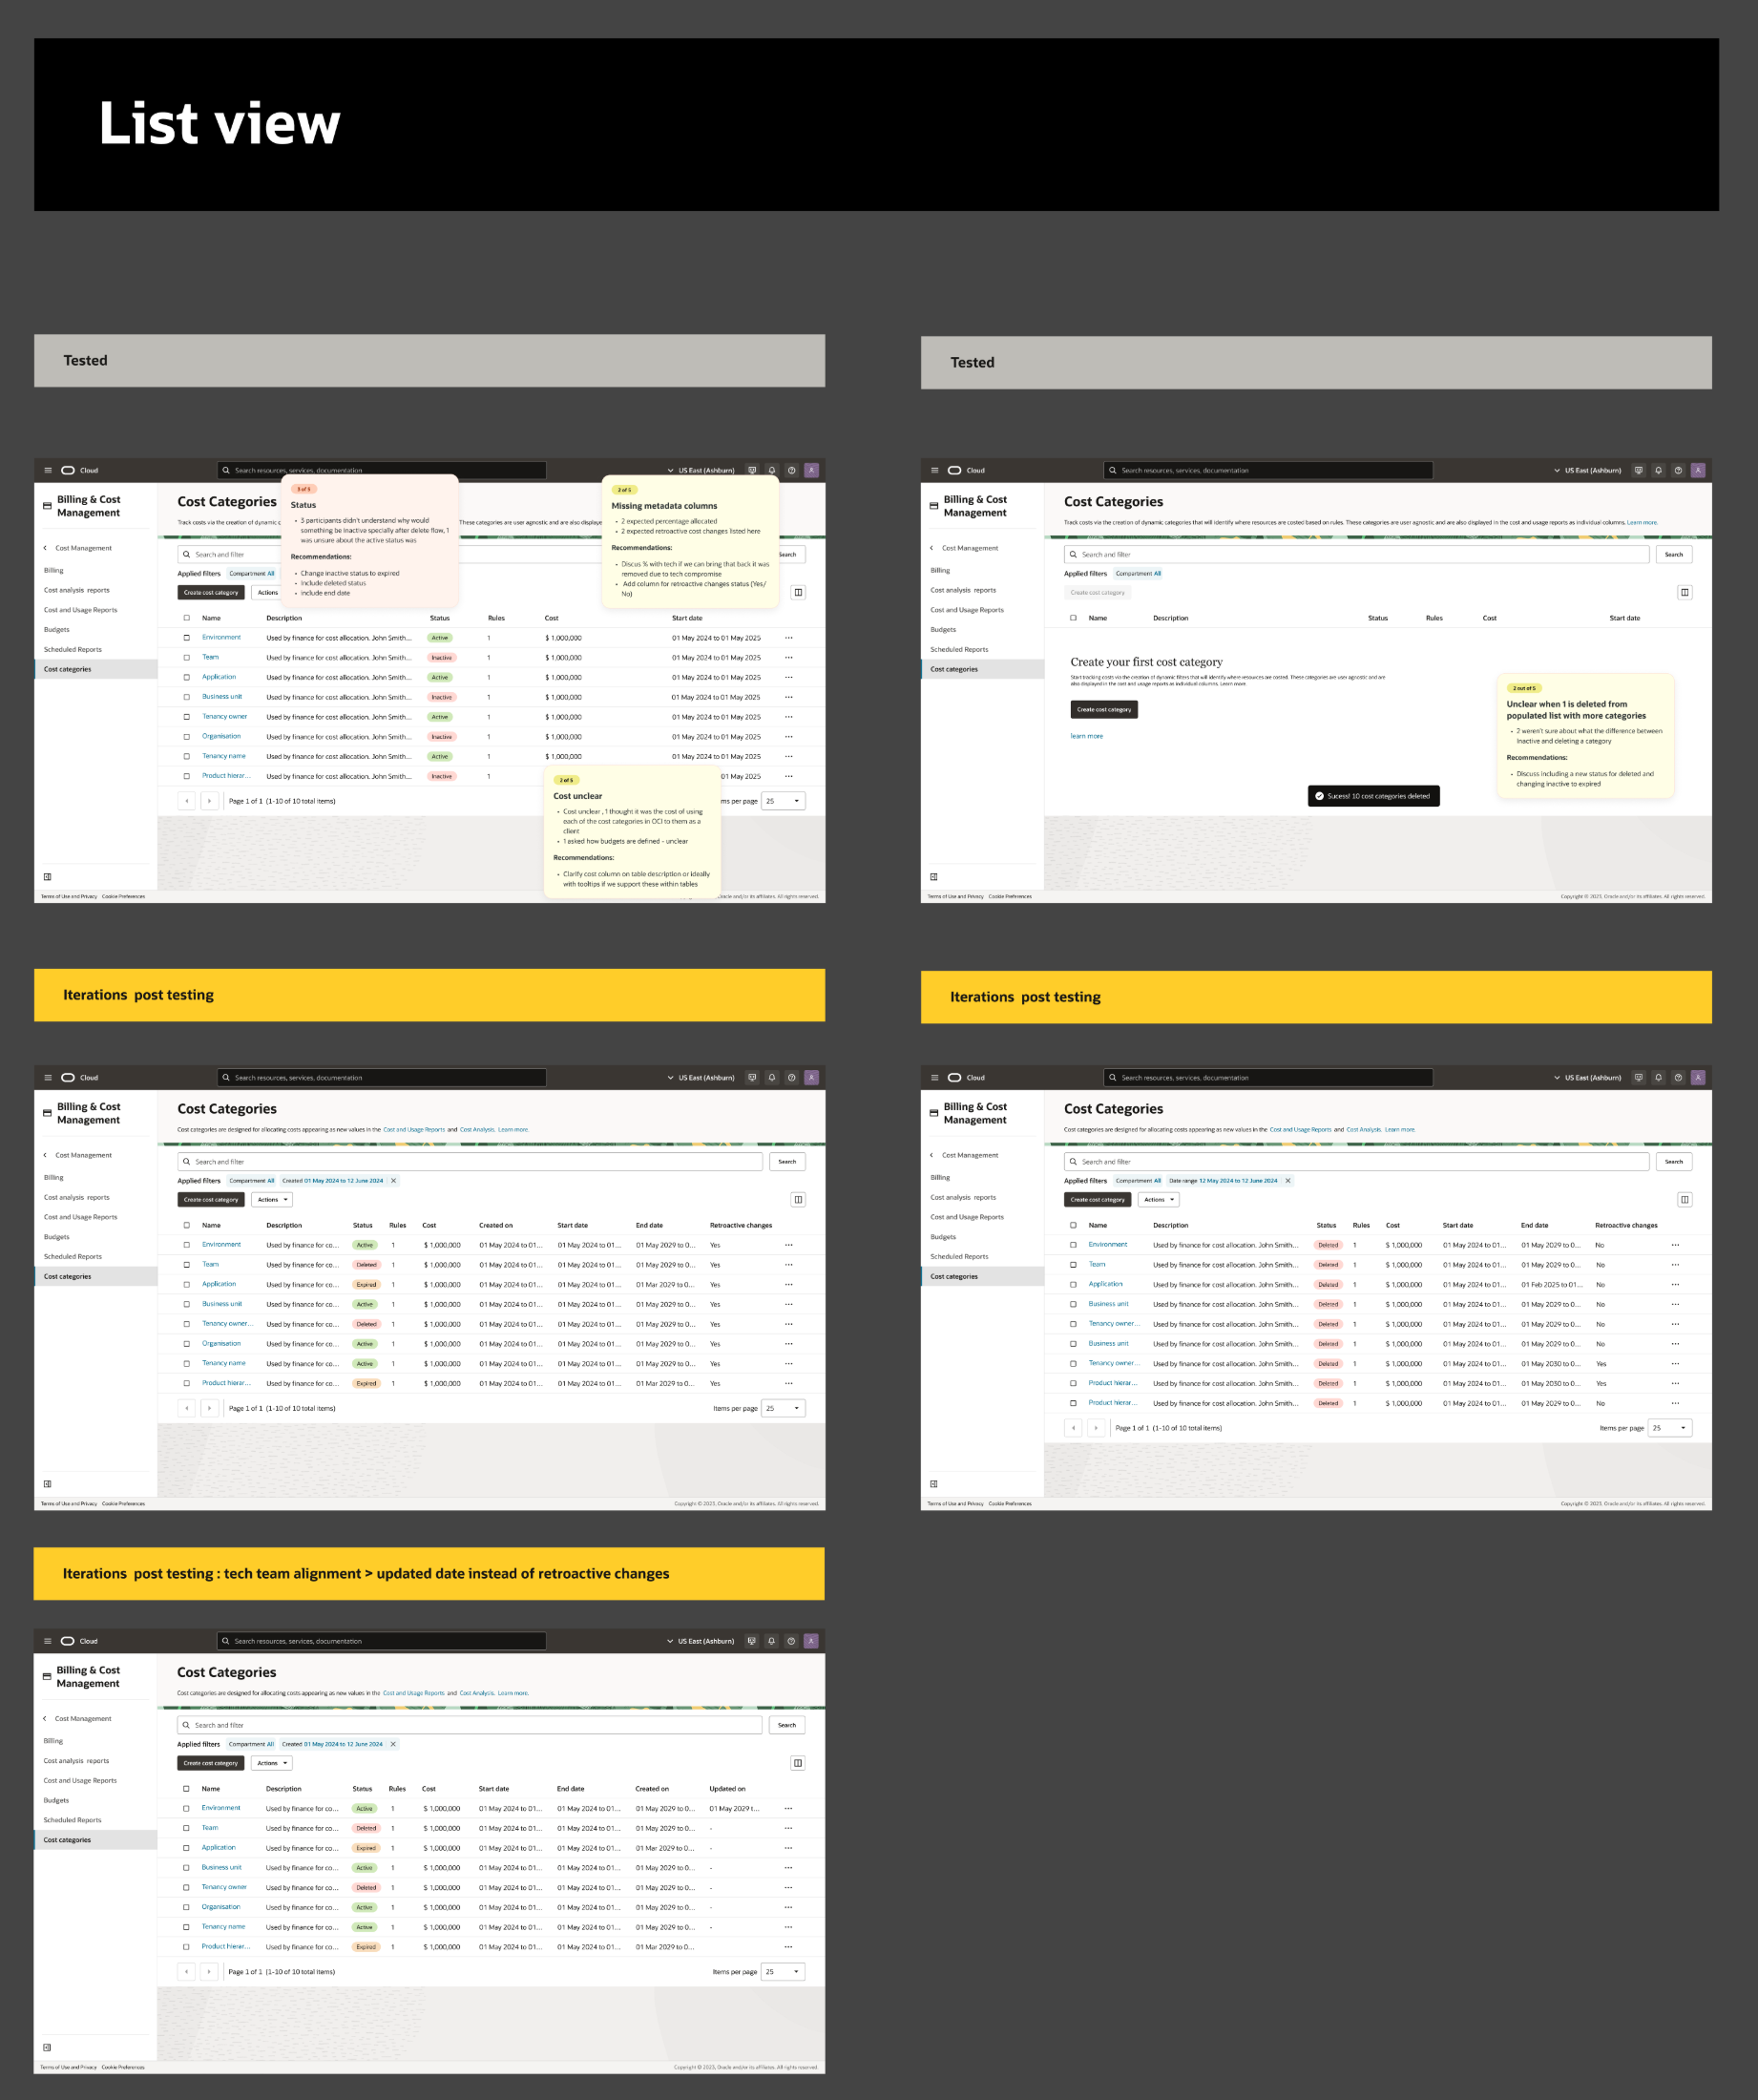
List view: status clarity between deleted and inactive, and retroactive-edit indicators.
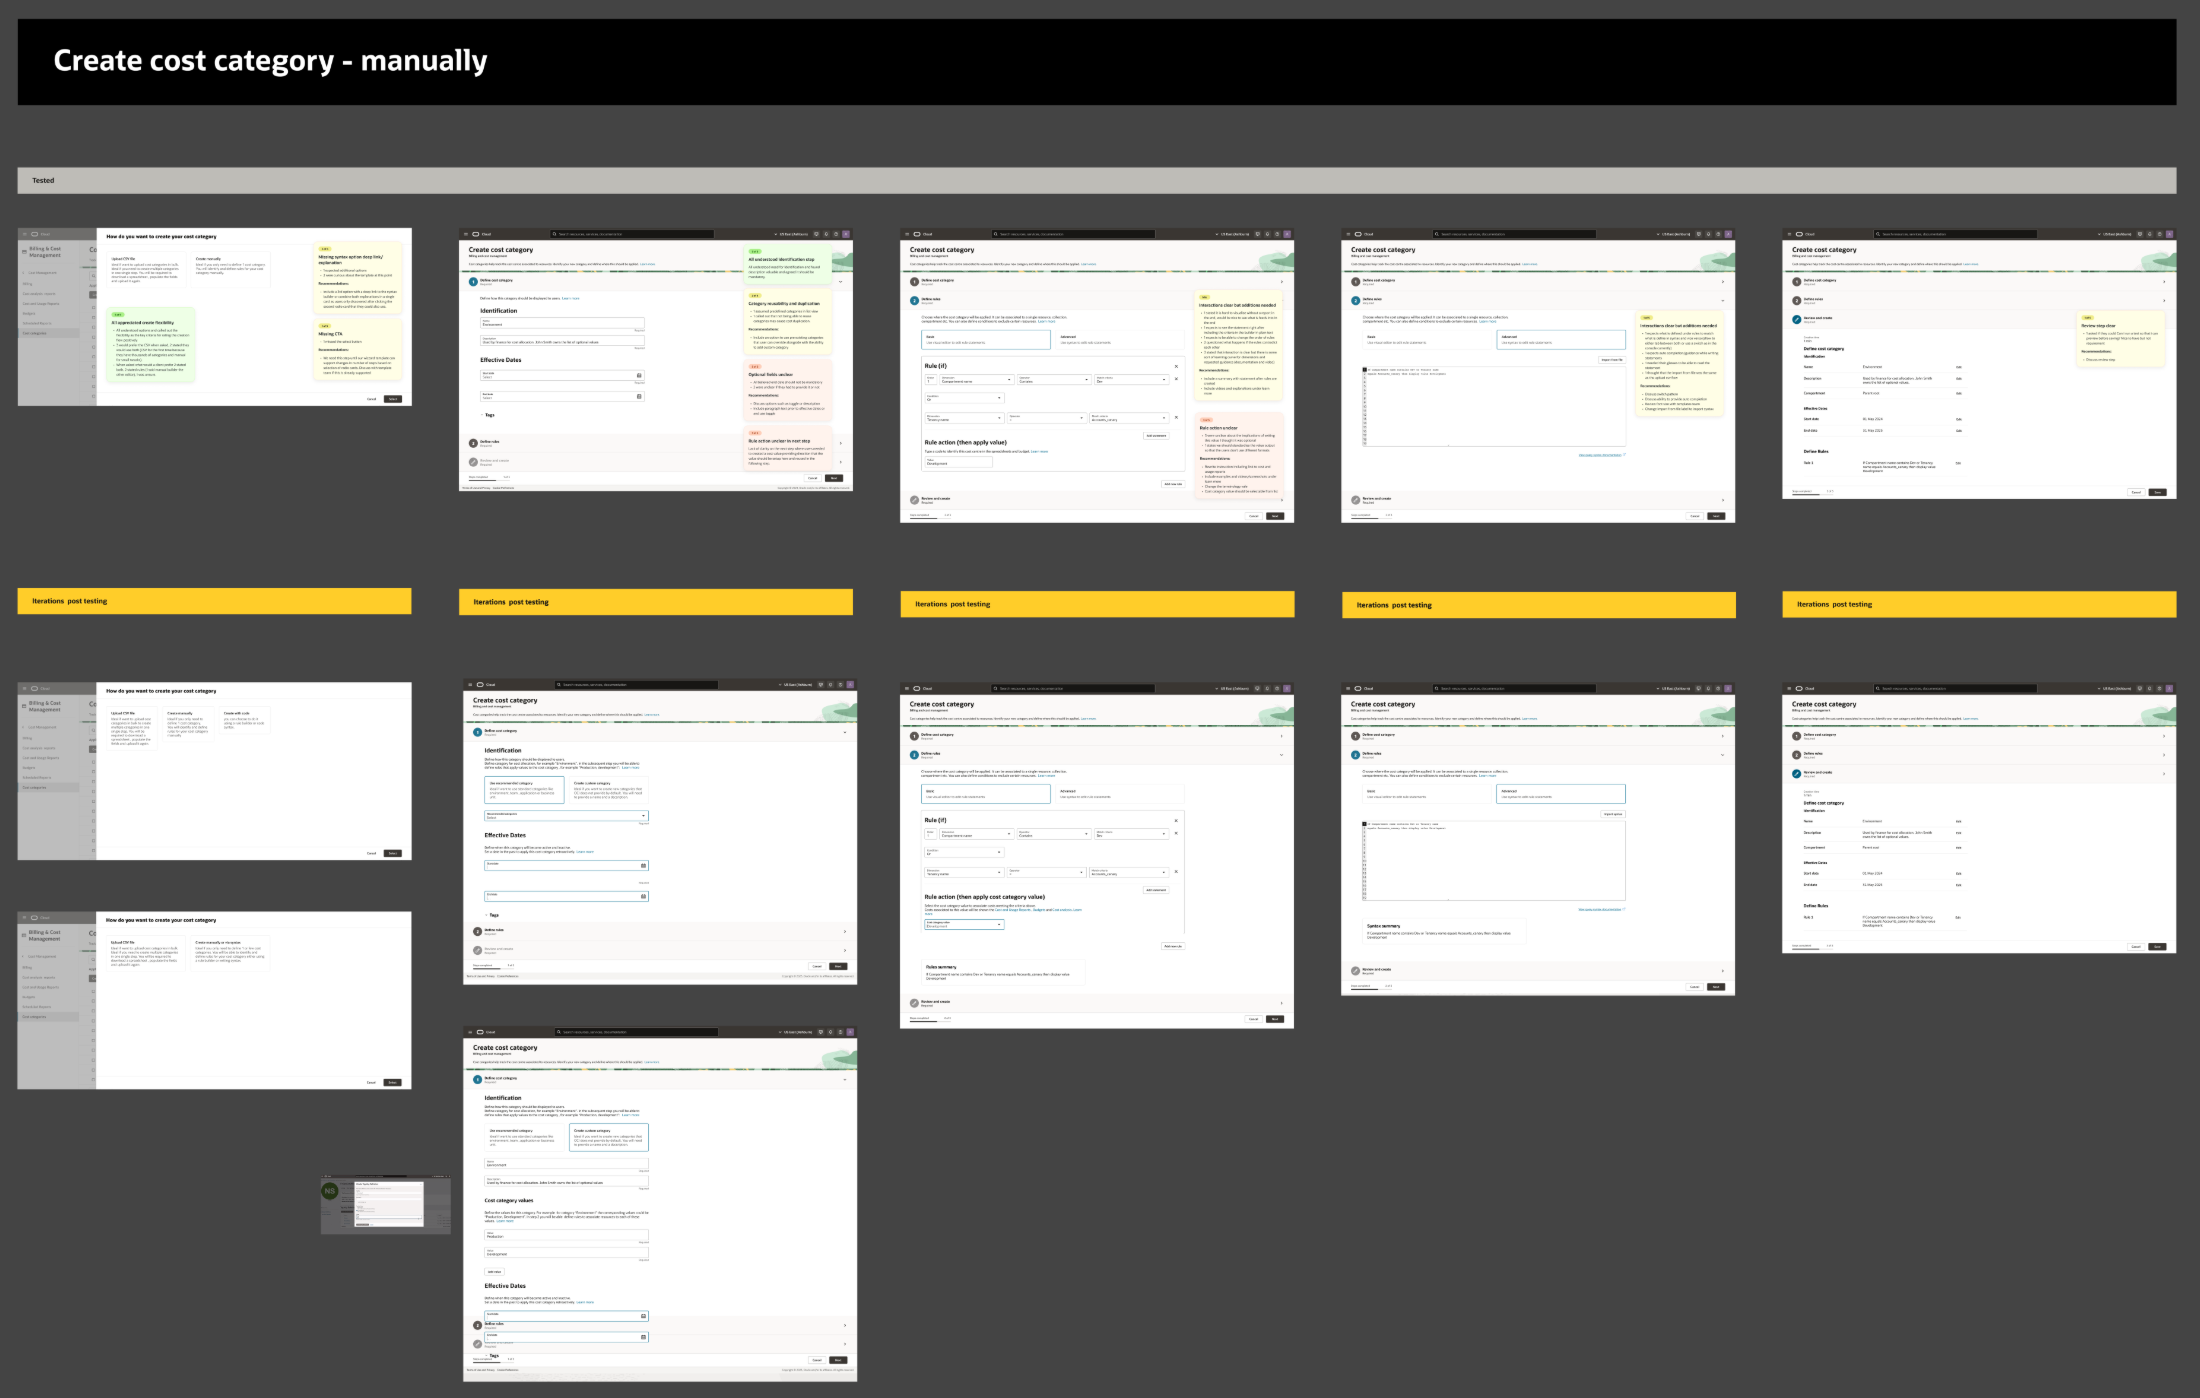
Manual creation: terminology and placement of the "rule value" field, and the syntax route.
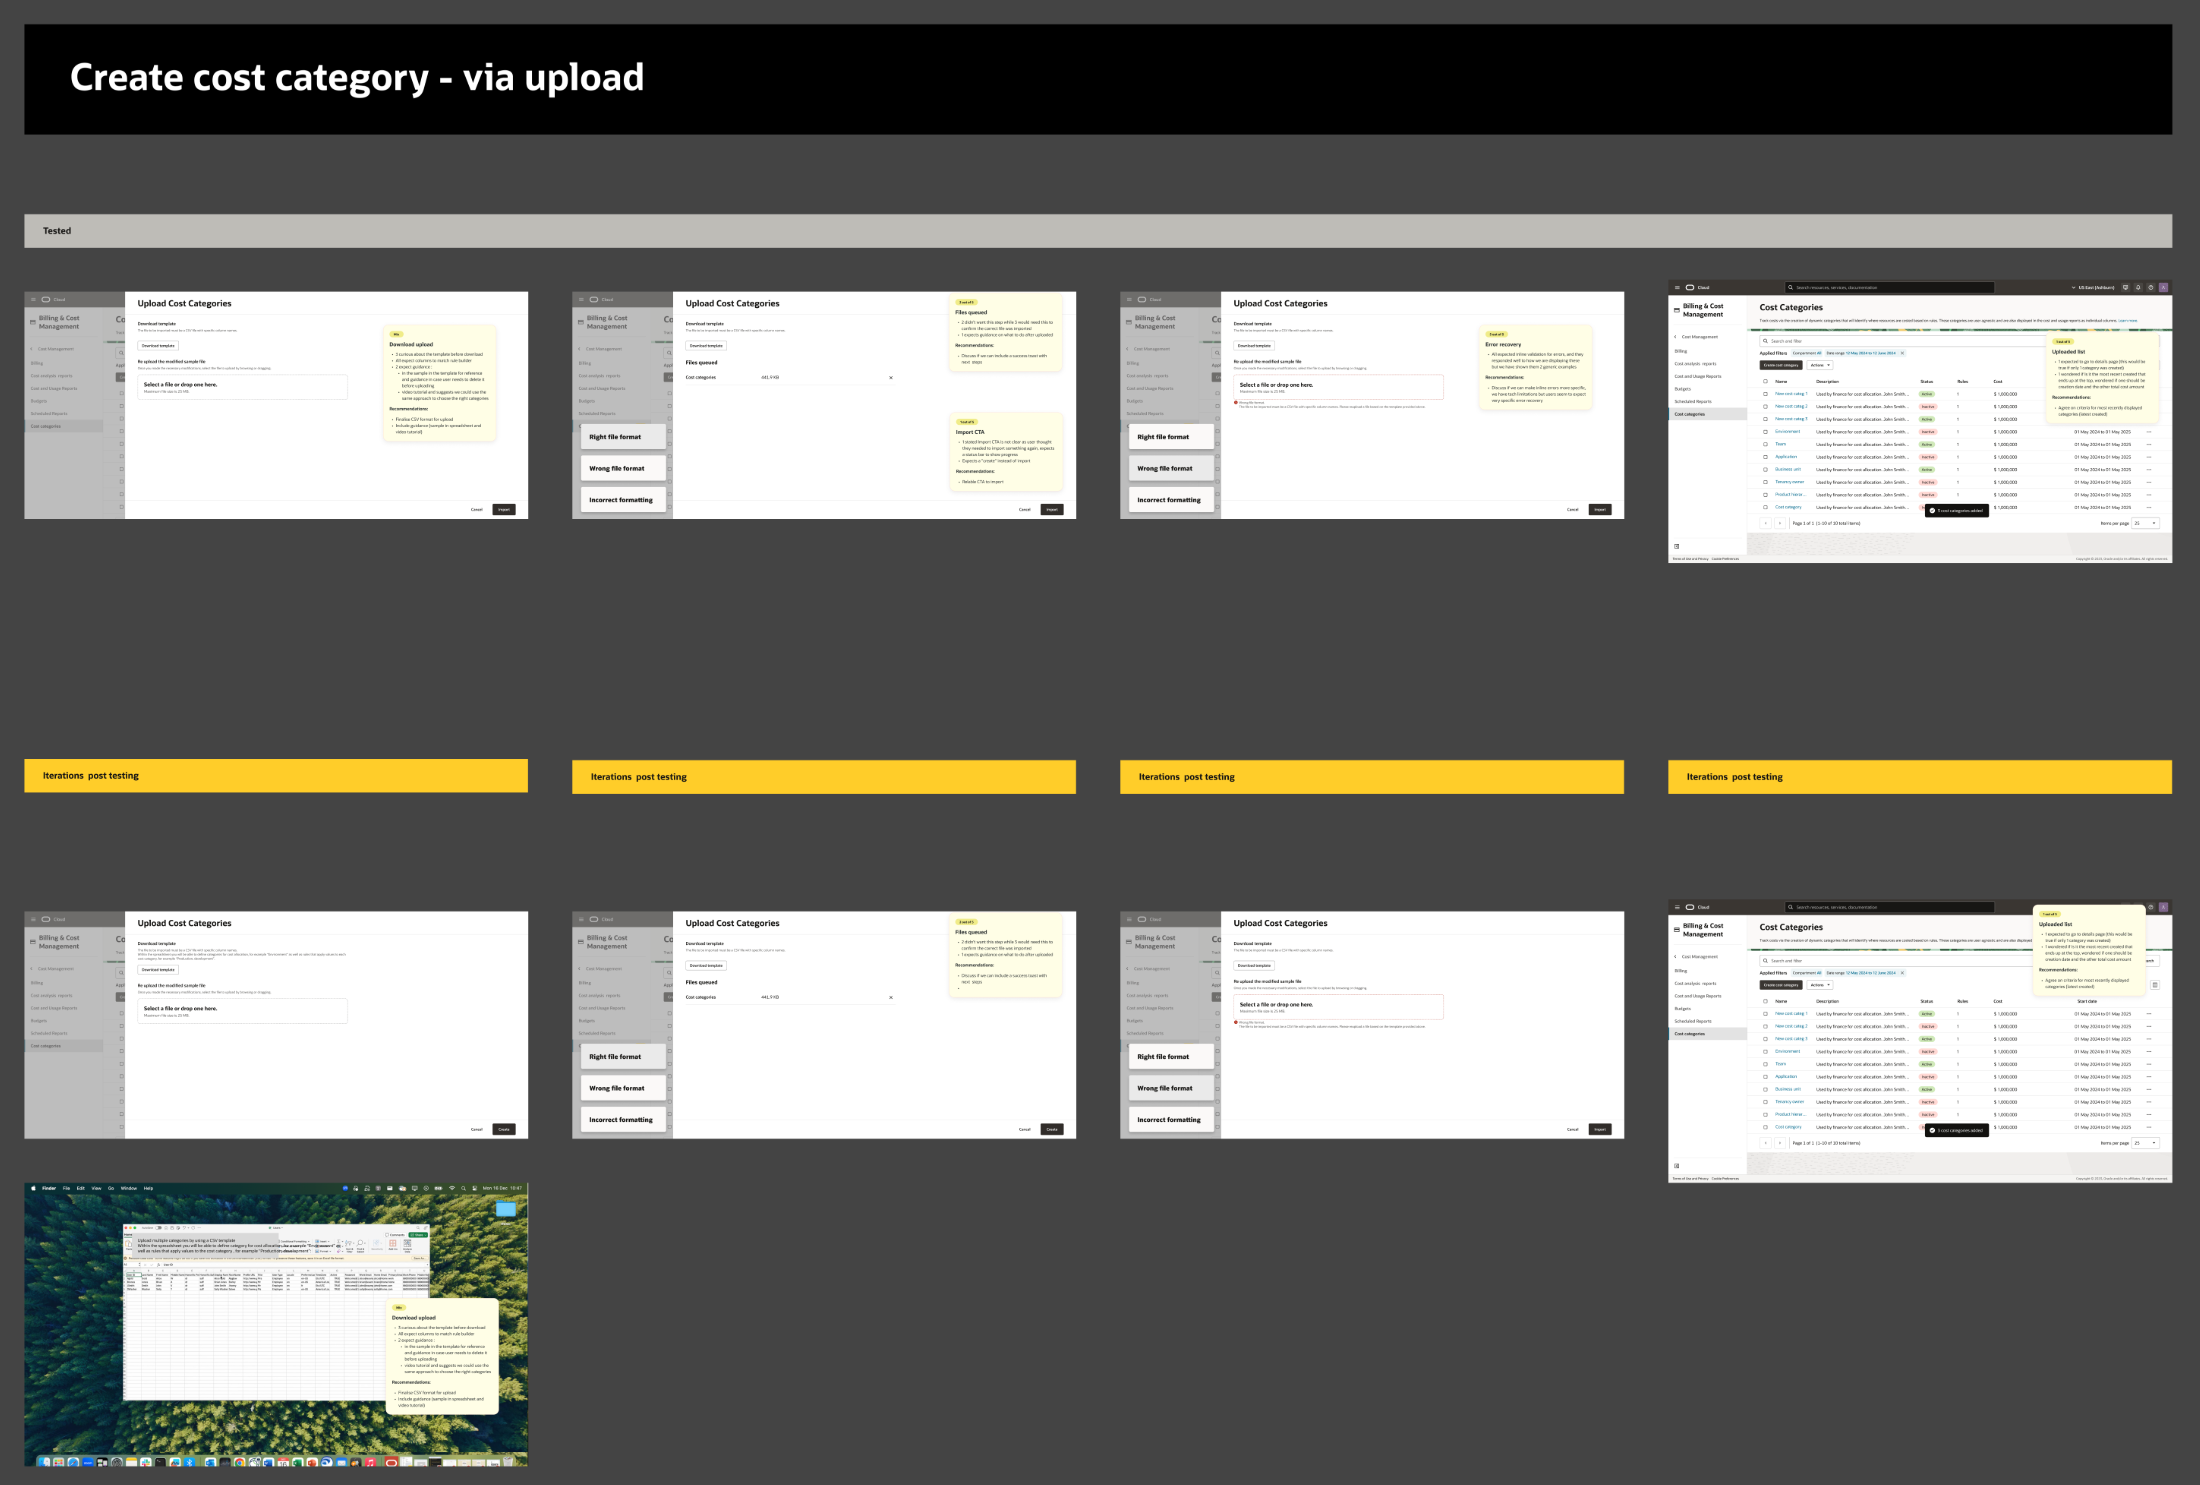
CSV upload: template guidance, import labelling, queued files and error recovery.
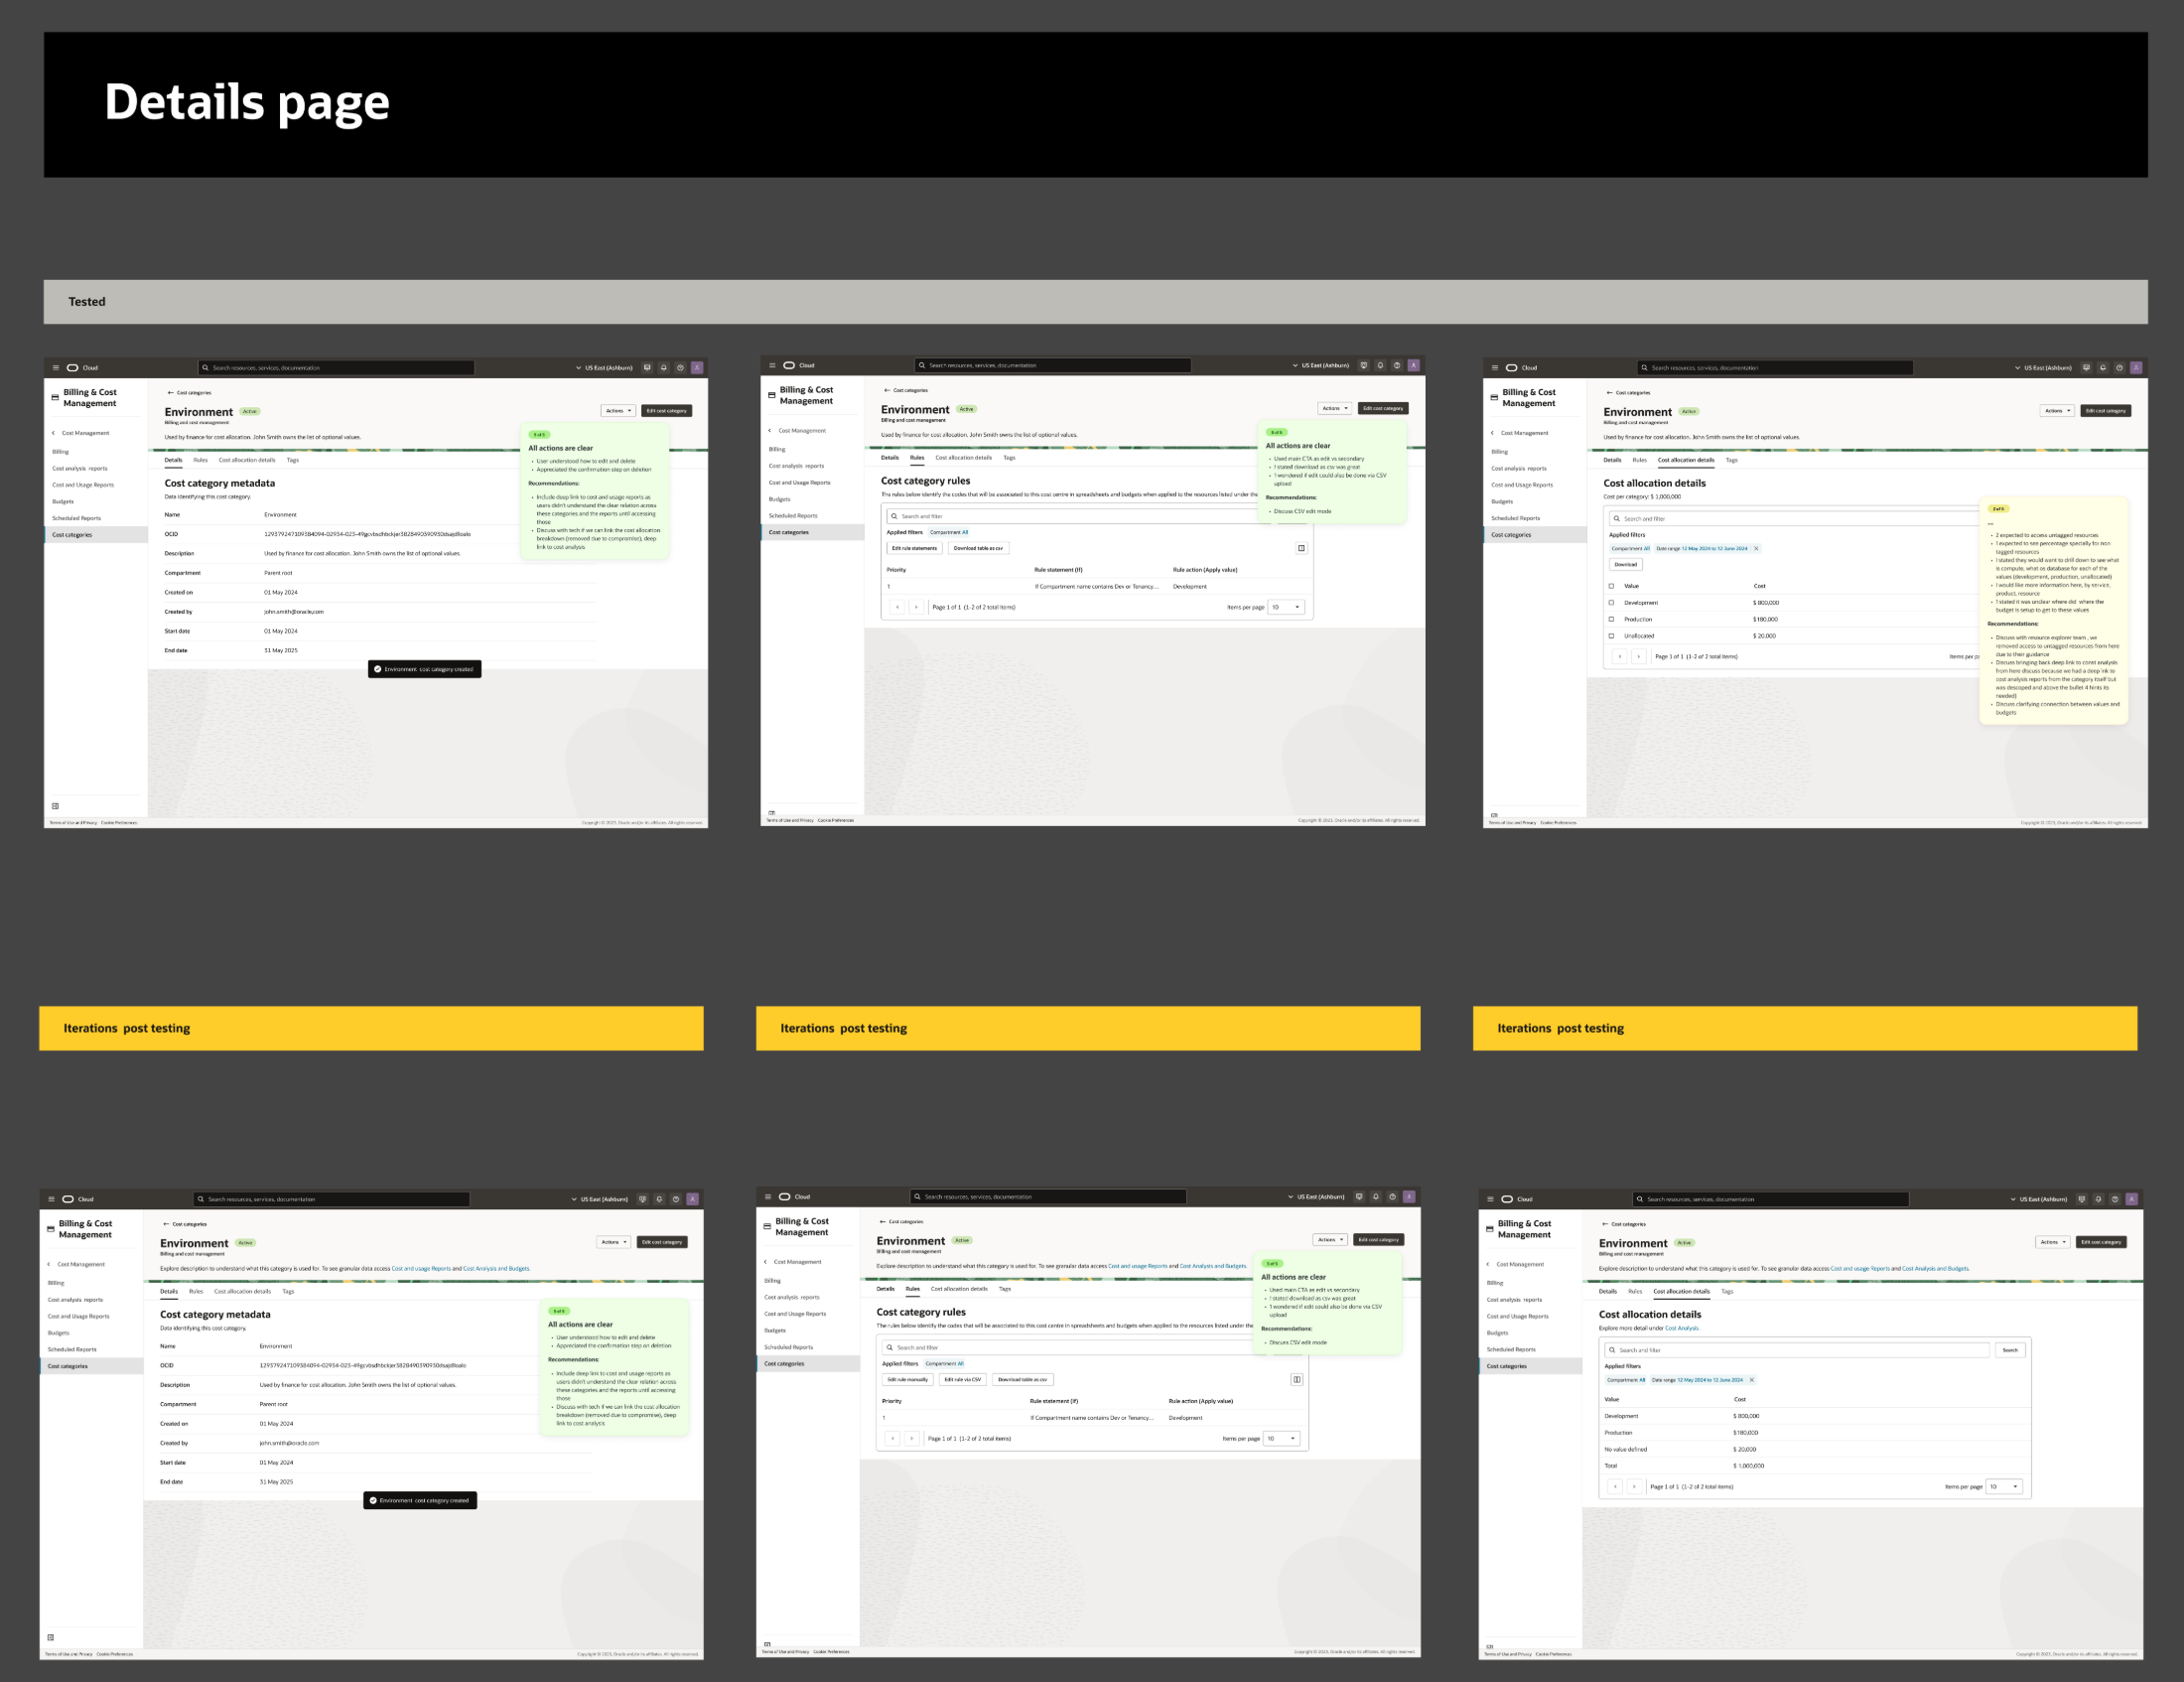
Details page: identification and rules split, so values can be reused.
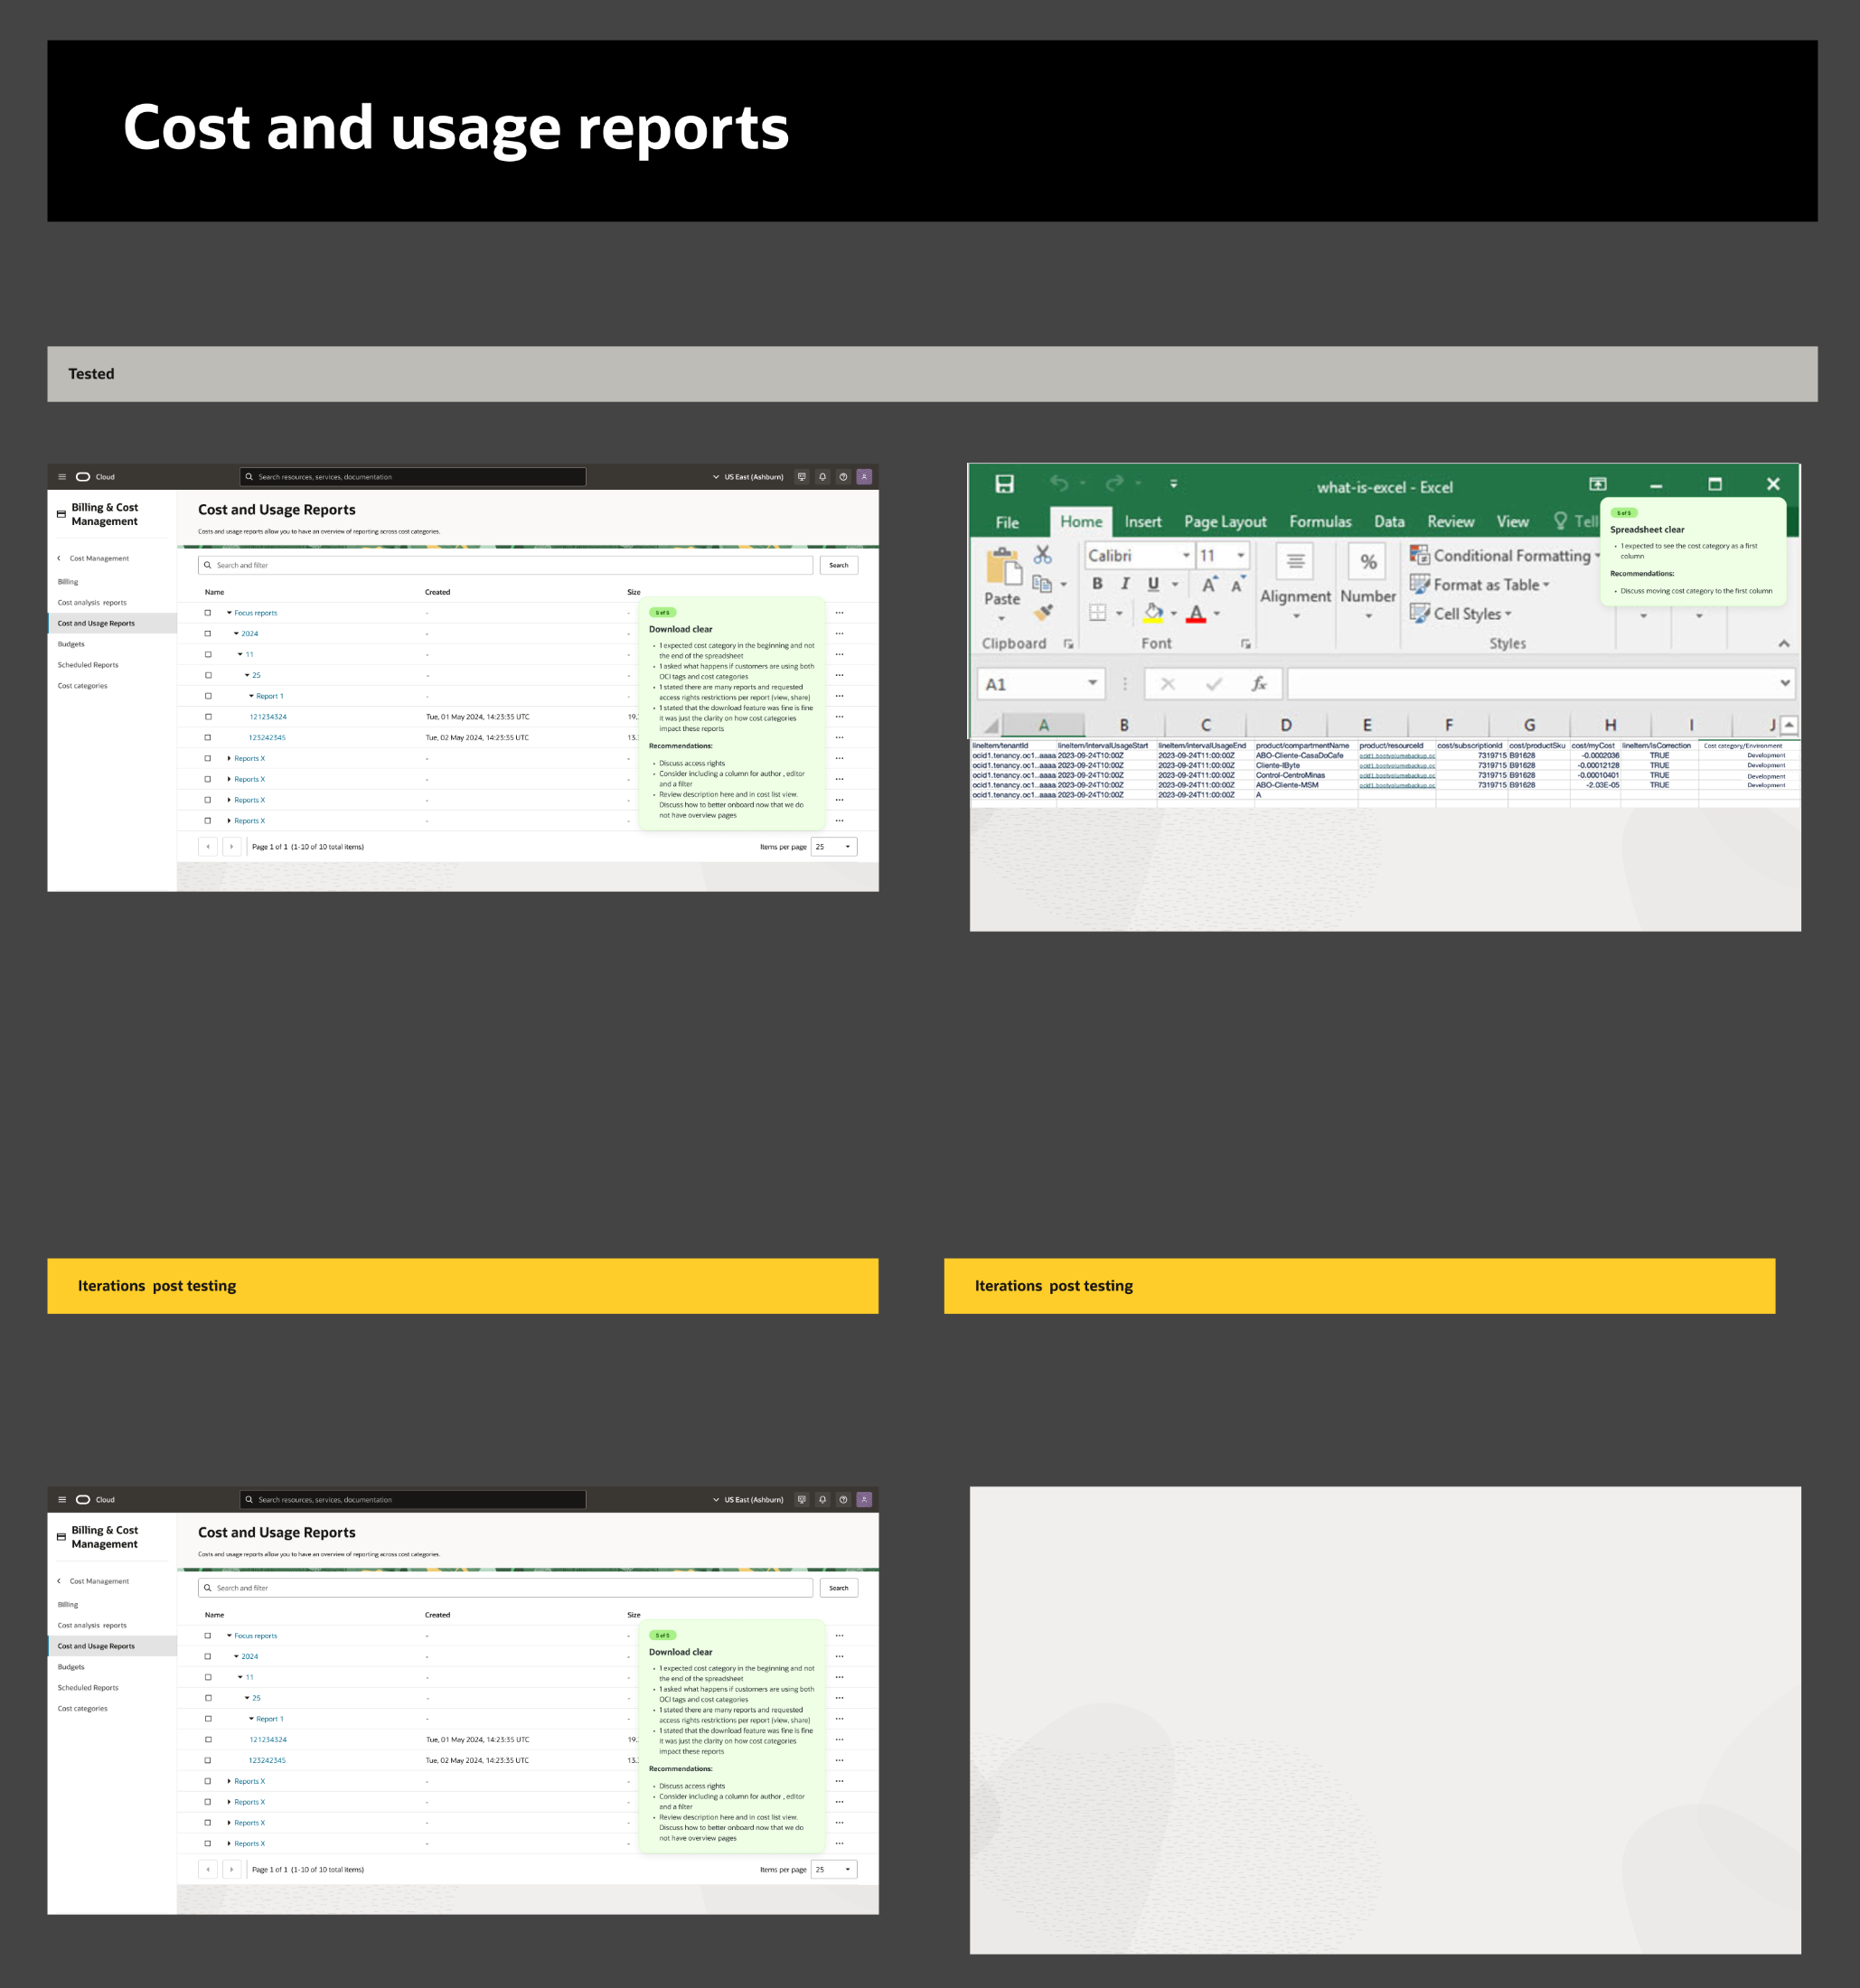
Cost and usage reports: category dimensions carried into the CSV export.
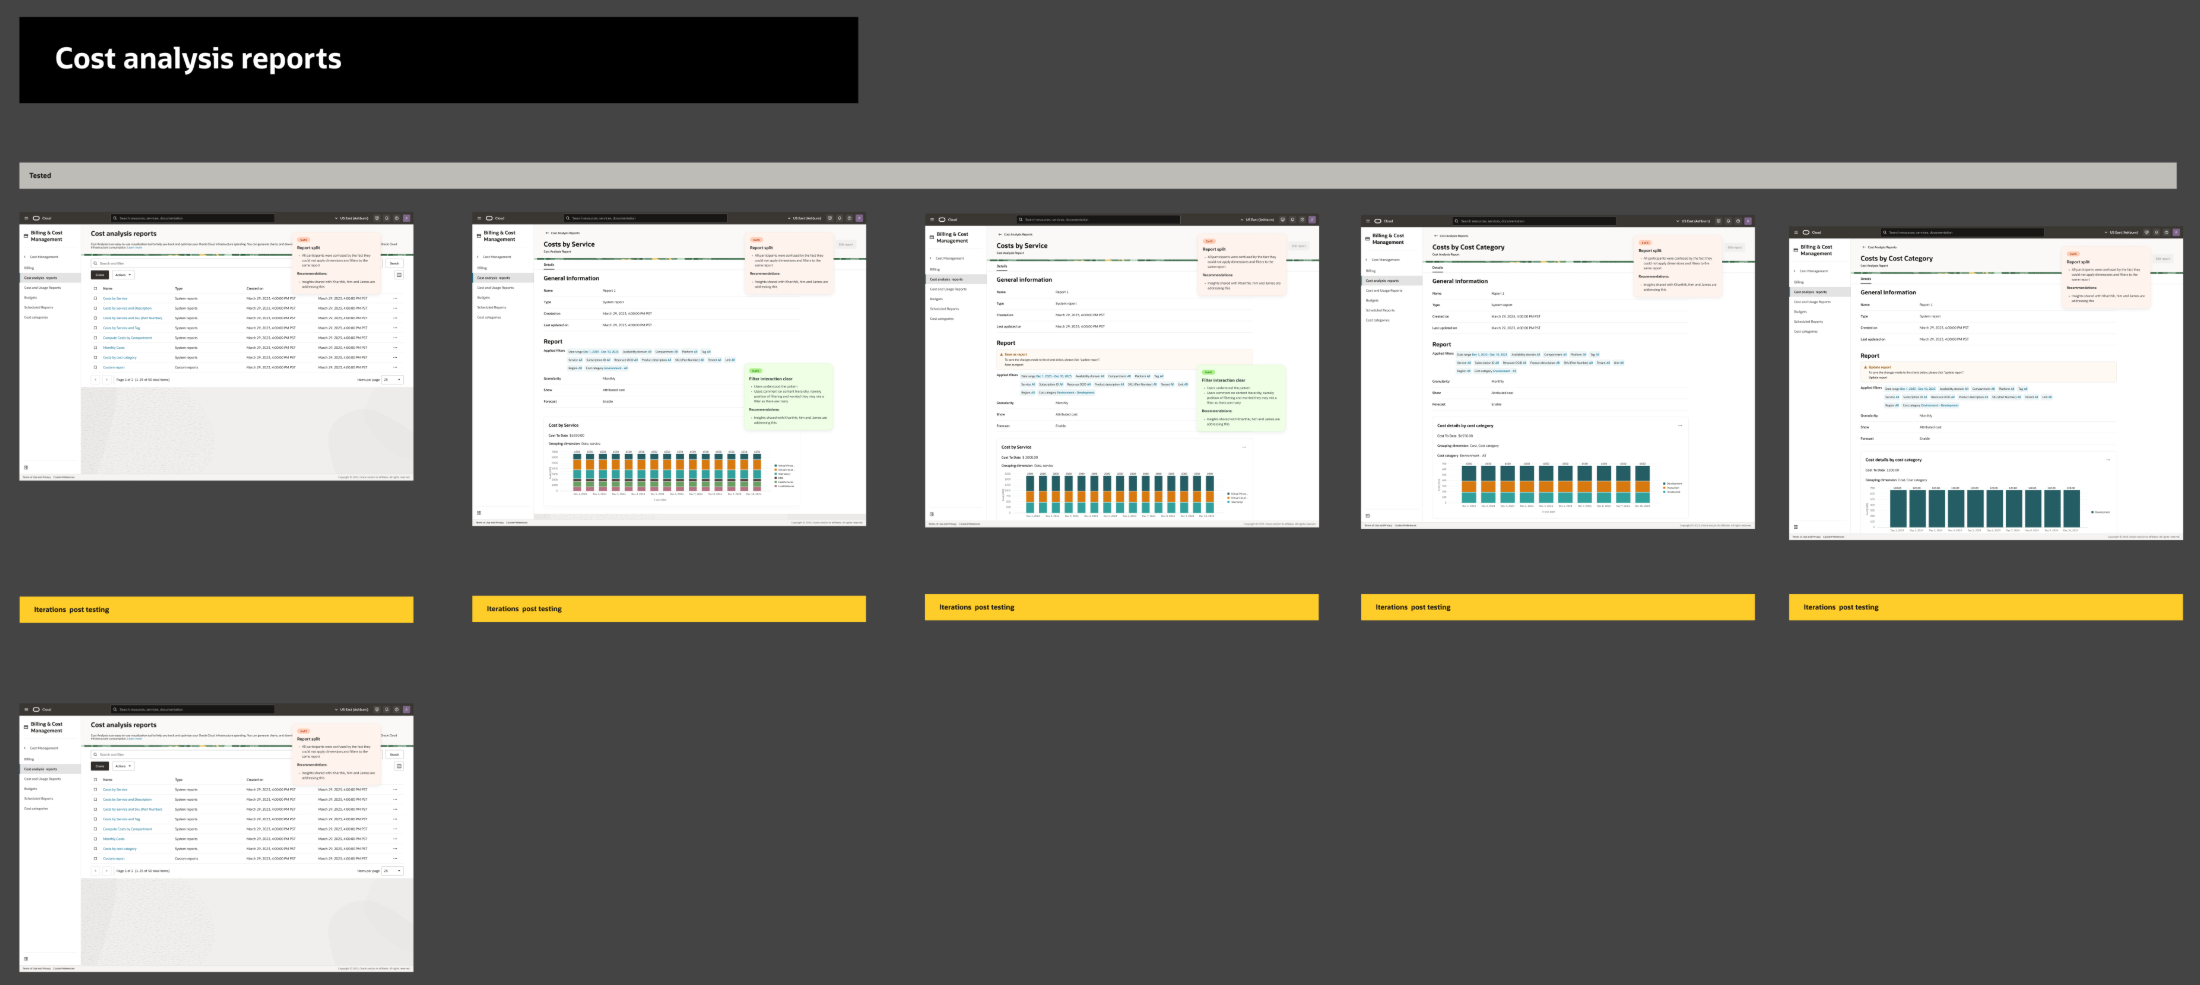
Cost analysis reports: combined filtering and grouping by category.
"Inactive" state confused with deleted.
"Expired" and "Deleted", plus end date.
Retroactive edits not identified.
Retroactive-changes column added.
Cost column read ambiguously.
Clarified in the description and a tooltip.
Every category built from scratch.
Reuse and override existing categories.
Rule value field unclear to 3 of 5.
Value moved to identification, reusable.
Rules had no plain-language summary.
Plain-text summary, rules reorderable.
Syntax builder hidden under manual.
Third option on step one links to it.
"Import from file" read as CSV upload.
Renamed "import syntax", with hints.
Order after upload was ambiguous.
Latest-created set as the order.
Summary of main iterations applied after testing, mapped to the section each finding came from.
Results & Business Impact
Results & Business Impact
A 75% simpler path to trustworthy cost data
By removing the access wall and consolidating a disjointed 40-step process into 10, the redesign directly served the business objective of removing activation barriers: user activation and platform engagement improved, contributing to monetization through higher feature adoption and reduced churn.
Task success rate, above the 80% benchmark.
Satisfaction score, alongside a 4.3/5 usability rating.
Reduction in process complexity, 40 steps to 10.
A path for every persona
Bulk CSV upload, a logic-based rule builder, and a code syntax editor gave Finance, cloud architects and engineers a way to create cost categories that matched how each of them actually worked, instead of forcing one workflow on everyone.
Cost data users could trust
Retroactive edits, clearer active/inactive states, and a single, centralized cost-categories home replaced the confusion caused by incorrectly tagged resources and a fragmented, cross-service workflow.
"The real shift wasn't visual polish, it was collapsing a 40-step, three-service maze and its access wall into one trustworthy flow, meeting users where they already worked, whether that meant bulk CSV upload, a rule builder or code, so they could finally act on their cost data instead of fighting to find it."
Access barrier removed to non technical users
Non-technical personas like Finance, previously locked out by permission requirements, could now manage cost categories directly, widening who could self-serve on cost management.
75% less process to build and support
Collapsing three disjointed services and roughly 40 steps into 10 reduced ongoing support burden and gave engineering a far smaller surface to build and maintain.
Recommendations
Recommendations
What people say about working with me
“I worked with Inês at Oracle, and I can confidently say she is one of the most talented and empathetic UX designers I've ever worked with. I was extremely sad when she left.The title UX Designer does not do Inês justice. She is the complete package, conducting user research, design hypothesis testing, wireframing/prototyping, and collaborating with engineering. She is a collaborative, creative, and strategic thinker, challenging my assumptions and working around technical constraints.Inês quickly comes up to speed, deeply understanding new personas, their problems, and existing solutions. I was amazed that within a few conversations we had multiple concepts translating the users' complex problems into intuitive user experiences. While quick to come up with concepts, I really appreciated that she doesn't just “design.” She listens and questions until she fully understands the users' needs and their goals so she can deliver a delightful solution.Her designs not only look beautiful, but they work, solving real problems and driving measurable impact. If you're looking for someone who can elevate your product's user experience and bring fresh, human-centered ideas to the table, I can't recommend Inês highly enough.”