1,000+ insights from 60+ users across 4 countries, distilled into one shared foundation for redesign.
Countries researched: UK, Romania, Japan, Singapore.
Participants: internal users, clients and partners.
Insights synthesised into personas and user stories.
Project Overview
Project Overview
The user problem
The tool was a highly technical configuration and administration platform, used internally by configurators and administrators as well as by clients and partners. We needed a detailed understanding of this range of users, their needs, and how they interacted with the software during a project implementation, plus a clear-eyed look at the confusion around global navigation.
The business objective
Inform the redesign of a sophisticated B2B web application with evidence rather than assumption, giving product and design a shared, research-backed foundation to prioritise and sequence a large, multi-year redesign across a genuinely global user base.
My role and scale of ownership
I led this complex, large-scale generative research initiative end to end across 3 months and 4 countries, Romania, the UK, Japan and Singapore. I owned every design phase, from data collection, synthesis and stakeholder readouts, working cross-functionally with product to ensure the outputs were both globally relevant and locally nuanced.
How I got from insights to product value
Plan
An activity planning workshop with product stakeholders set the timeline and made sure research fed directly into project planning.
Understand the business
A stakeholder map and service blueprint clarified how the service was delivered and who was involved.
Understand the users
60+ structured interviews, contextual inquiries and surveys across 4 countries covered every user type, internal and external.
Synthesise
Personas, affinity diagrams, user stories and card sorting turned 1,000+ insights into clear direction for design and IA.



Execution
Execution
Understanding the research focus
"A highly technical tool used by very different users: we needed to understand who these were before we could redesign for them."
This research project focused on understanding in detail who the different types of users of a configuration and administration tool were, and what the main pain points were of using this legacy software, which had a highly technical nature.
Given that it was used internally (by different types of configurators and administrators) as well as by clients and partners, there was a need to understand in detail the range of users, the specific needs of each of them, and the interactions they all had during the course of a project implementation, and how the software could support it.
Apart from understanding the users and their specific needs across multiple journeys within the platform, one critical aspect of the research also focused on clarifying the issues around the global navigation across the system.
Planning the research
"A shared timeline, agreed with product upfront, was what let research feed straight into planning instead of running in parallel to it."
Before anything else, the research phase was planned alongside the product managers to make sure we had the necessary time to collect the data we needed and agree on timelines for the research deliverables.
- The workshop involved both UX and product stakeholders.
- A draft plan was discussed together using a whiteboard exercise, asking participants to lay out all the activities that would need to take place.
- This made sure product and UX teams were aligned on the research initiatives and that these were reflected in product planning for project activities.
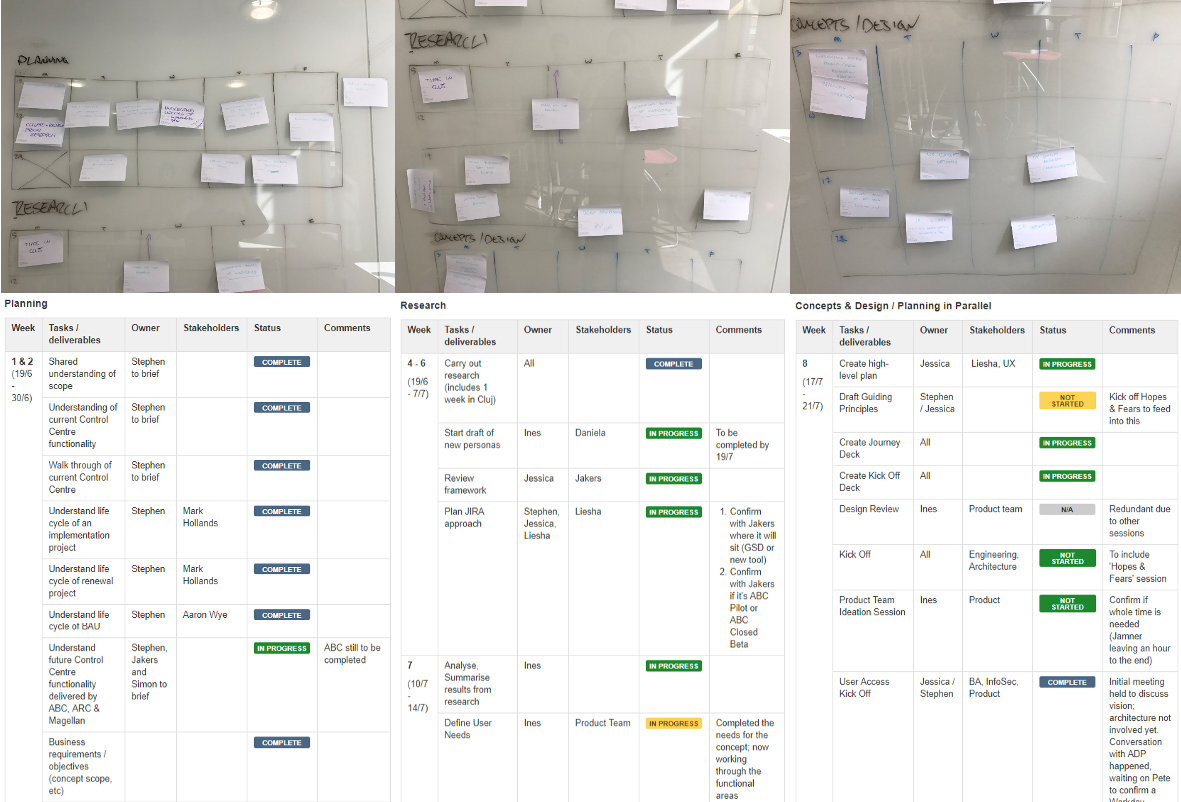
Whiteboard exercise laying out planning, research and concepts & design activities, translated into a tracked project plan.
Understanding the business: Service design research
"Stakeholder maps and service blueprints surfaced the interactions, interdependencies and relationships between everyone involved, providing insights on what the software needed to support."
The first step was to understand the business, to get a clear view of how the service was provided, and therefore have clarity over how this would impact any redesign of the software used to provide it.
The methods used to collect the data were:
- Stakeholder workshop
- Stakeholder maps
- Service blueprint
Stakeholder workshops took place with the support of the product stakeholders with questions about the main actors in the service and the phases in the service provisioning, also letting them illustrate their process using a whiteboard exercise.
After this session I drafted a stakeholder map, reviewed with UX and product for alignment, showing all groups in the service (staff, partners, clients) and how they related to each other, laying the foundations for the user research sample.
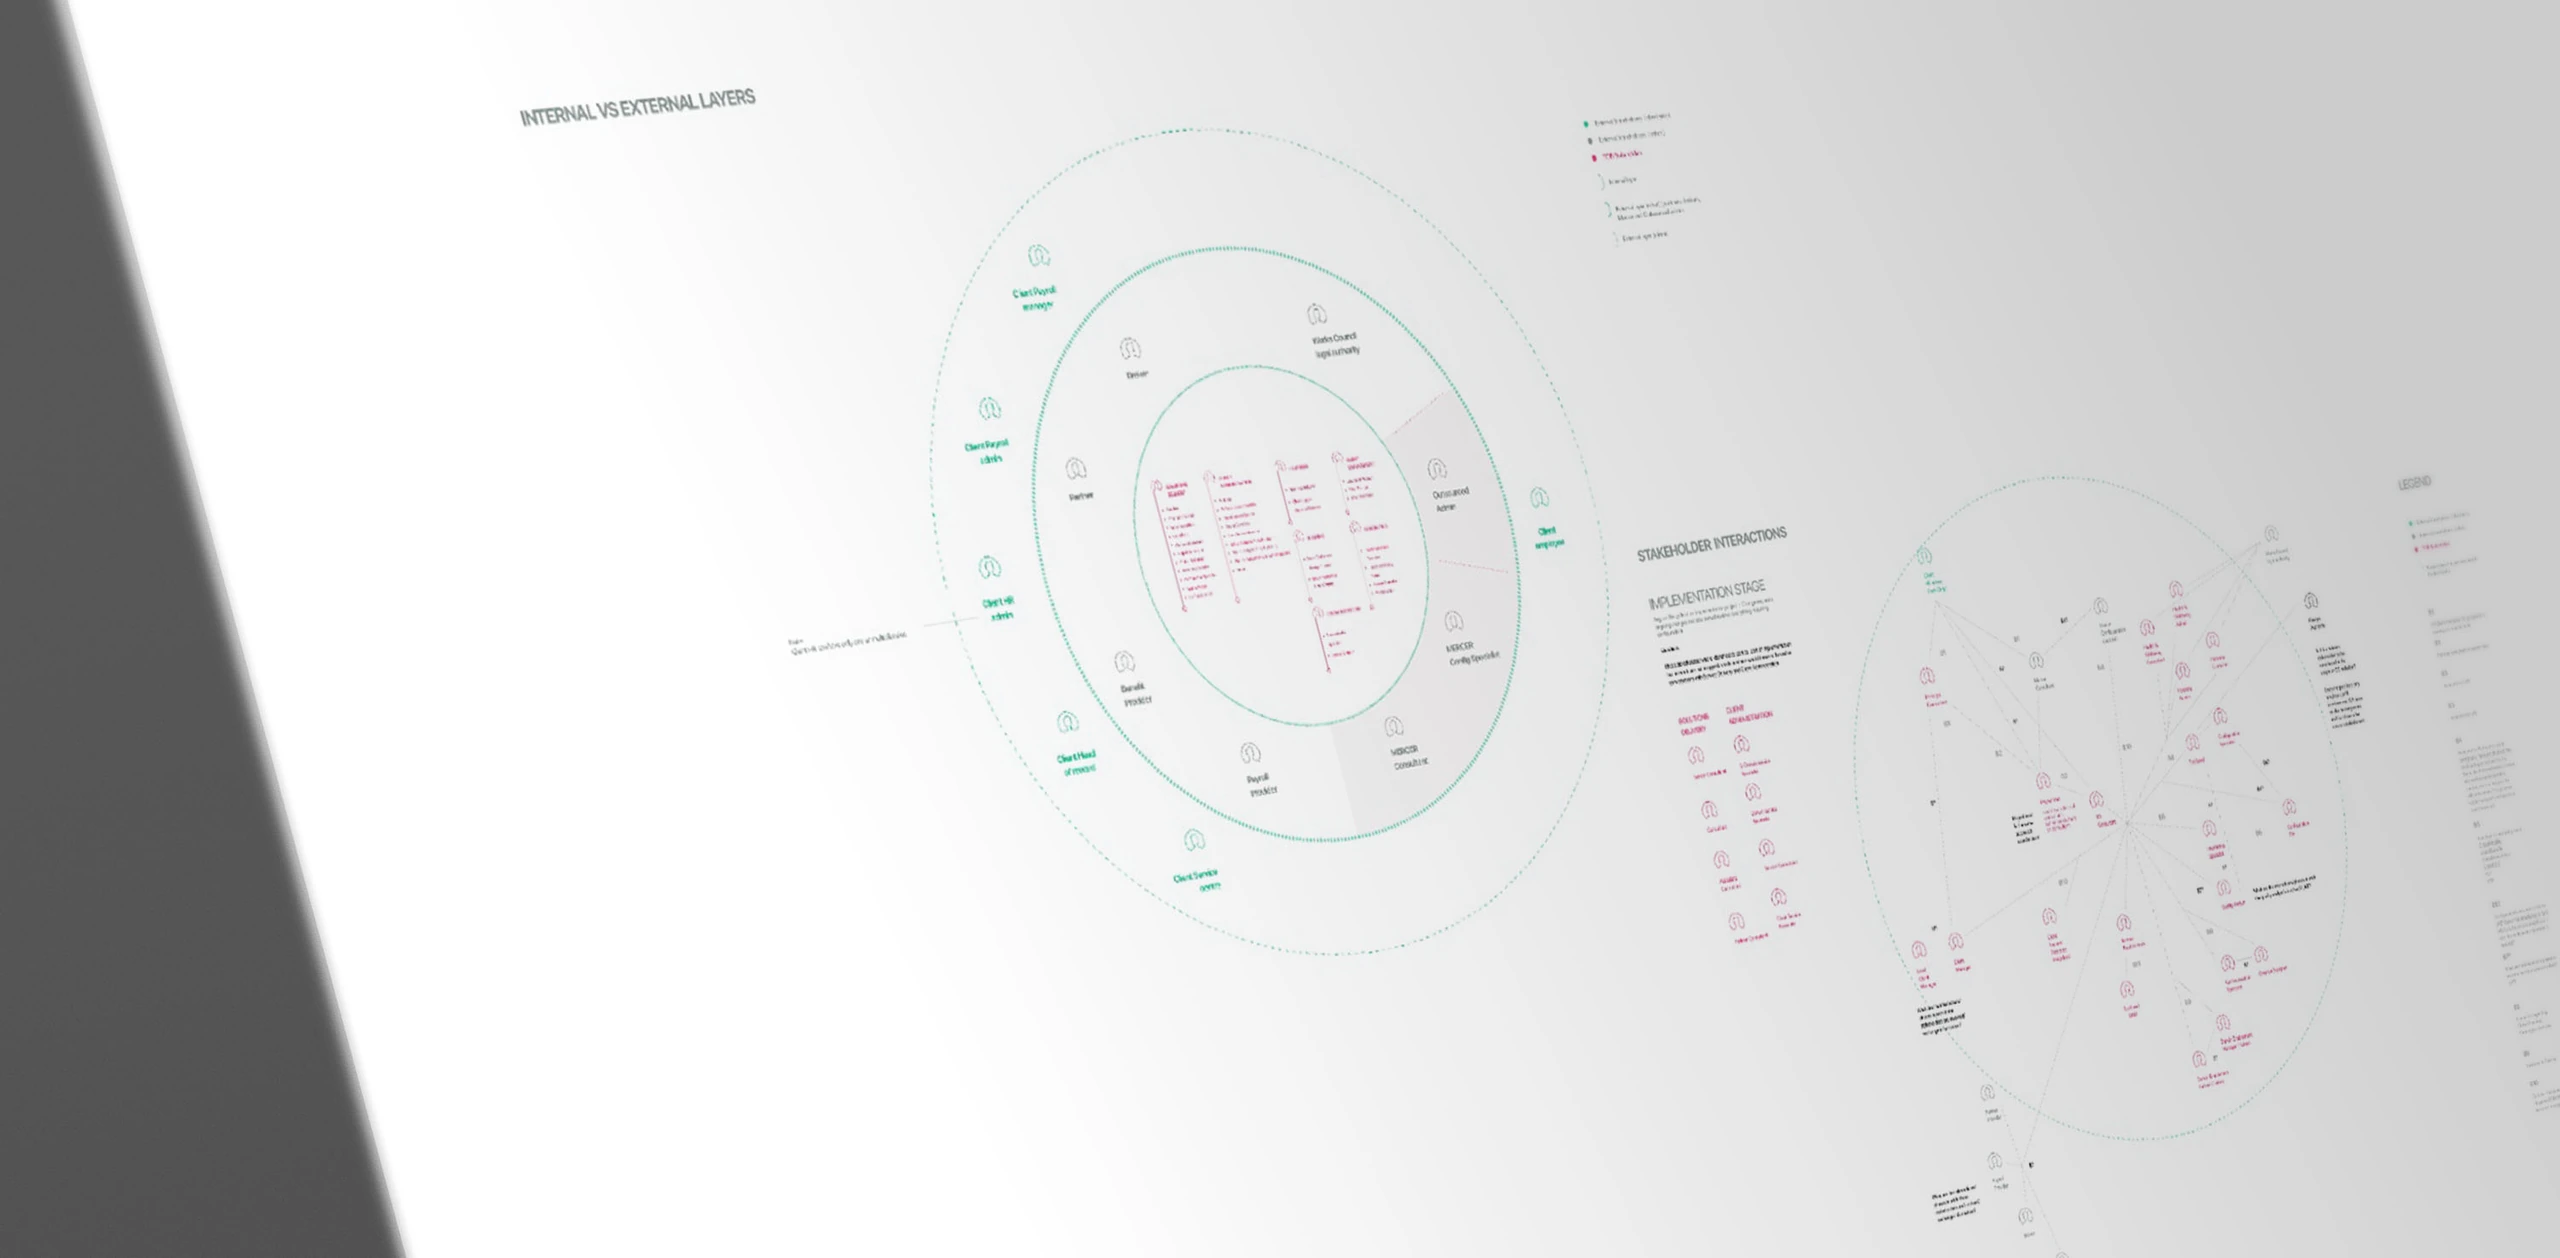
Stakeholder map and overview of interactions across stakeholders.
The next step was to define a customer journey map, which laid the foundations for the service blueprint. I started a first draft of the blueprint that we further iterated on as a team. It was a layout of how the service was provided by the company, its main layers of activity and actors, and it helped us understand handovers and dependencies more clearly. A blueprint is an ever-evolving document that results from co-creation, and this first draft evolved through the project.
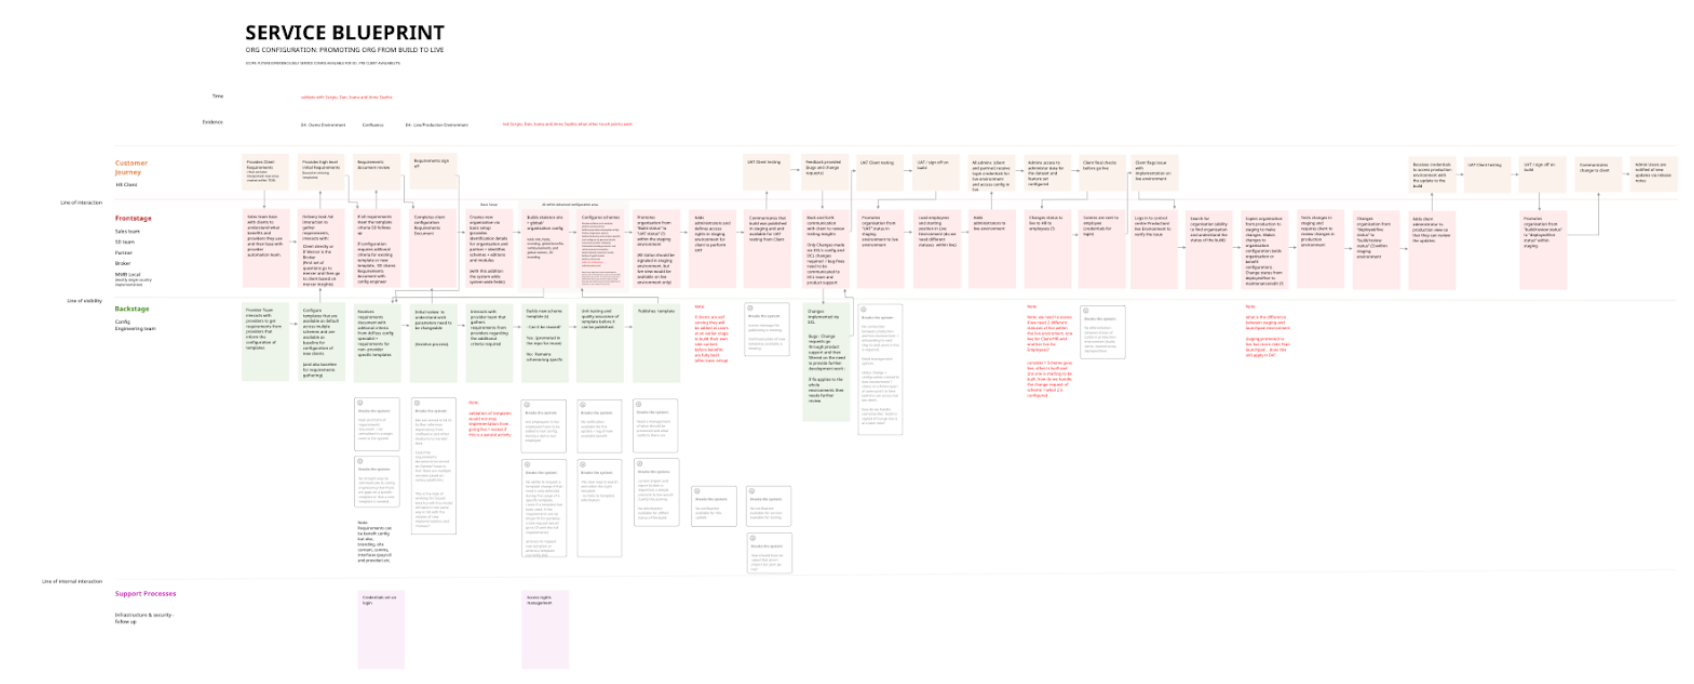
Service blueprint.
Understanding the users: User research
"Insights from structured interviews, contextual inquiries and surveys mapped straight onto the affinity diagram, which shaped both the user stories added to the backlog and the personas themselves."
Based on the knowledge gathered in the previous phase, I defined a representative sample for the user research. This broad sample covered 60+ users of the tool from multiple geographies, different levels of expertise, age and gender, and internal and external users across different specialisms (using different areas of the platform).
The methods we used to collect the data were:
- Structured interviews
- Contextual inquiries
- Surveys
To collect the data, I ran structured interviews (on site and remotely) and contextual inquiries in which I watched users performing tasks in the tool and prompted them with questions to better understand their needs with the current version of the software.
I recorded all interviews and contextual inquiries, generating more than 60 hours of recordings and transcripts. All of them were peer reviewed and added to a database, so we stored the data for future reference during other phases of the design process and reduced bias during analysis.
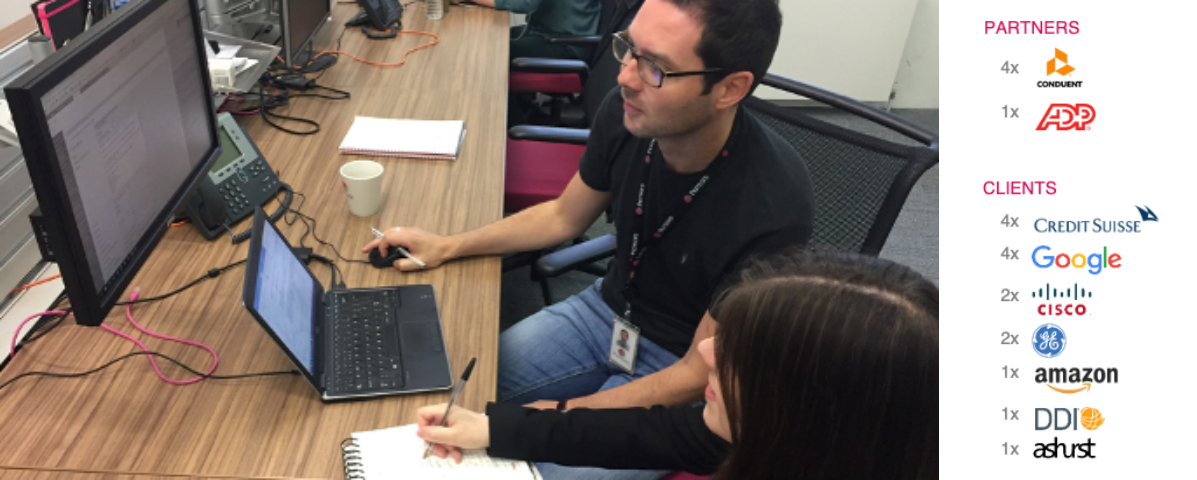
Internal users, partners and clients composed the 60+ user sample.
I also asked all research participants to fill in a survey, to understand detailed attitudes towards the existing platform and to define their product adoption profile (to anticipate how they would respond to a redesign).
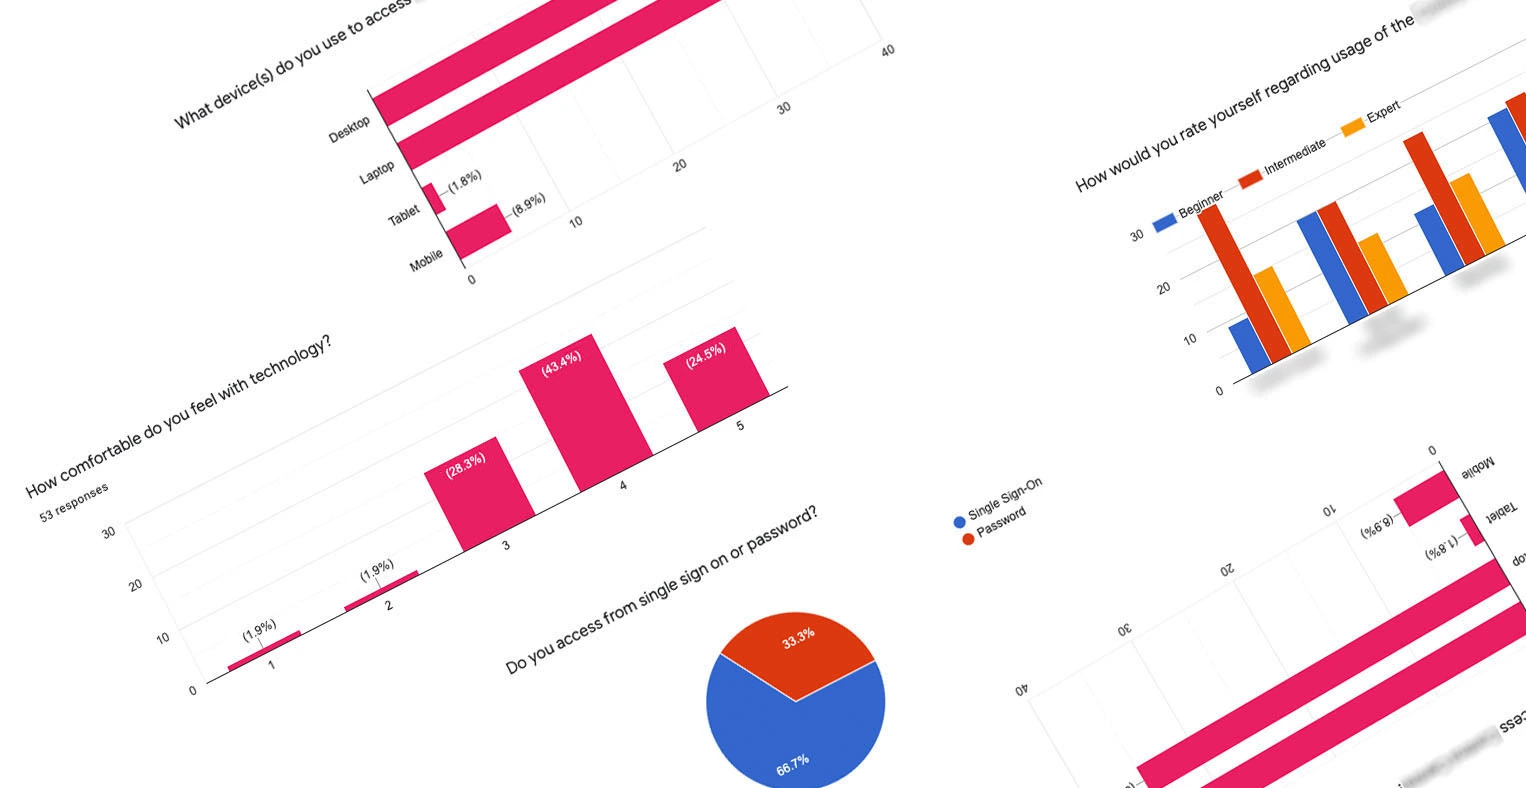
Survey results on device usage, comfort with technology, self-rated expertise and sign-on method.
Analysing the data
"With over 1,000 raw insights, the challenge wasn't collecting data, it was building a shared process the whole team could trust to turn it into direction."
Once I collated all the insights, I moved on to the analysis phase and defined the next steps, considering we wanted this data to inform the following stages of the process.
The methods I used to synthesise the data were:
- User personas
- Affinity diagram
- User stories
- Card sorting (categories informed by the affinity diagram and business requirements)
User personas
7 data-driven personas were created to help us design for every need, from the perspective of different types of users.
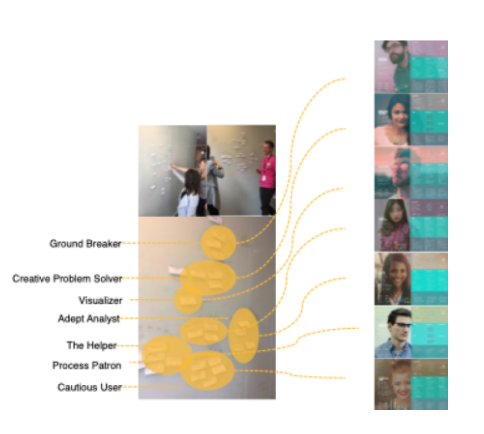
7 persona archetypes (Ground Breaker, Creative Problem Solver, Visualizer, Adept Analyst, The Helper, Process Patron, Cautious User) emerging from the affinity diagram exercise.
The persona archetypes were created through a team exercise in which I and the product team members who took part in the research phase built archetypes from the data collected, until we narrowed it down to a group of 7. We then linked each user representing an archetype in the database to that persona and aggregated data for the categories in the persona template based on their feedback. For survey metrics, we averaged their answers to represent the persona.
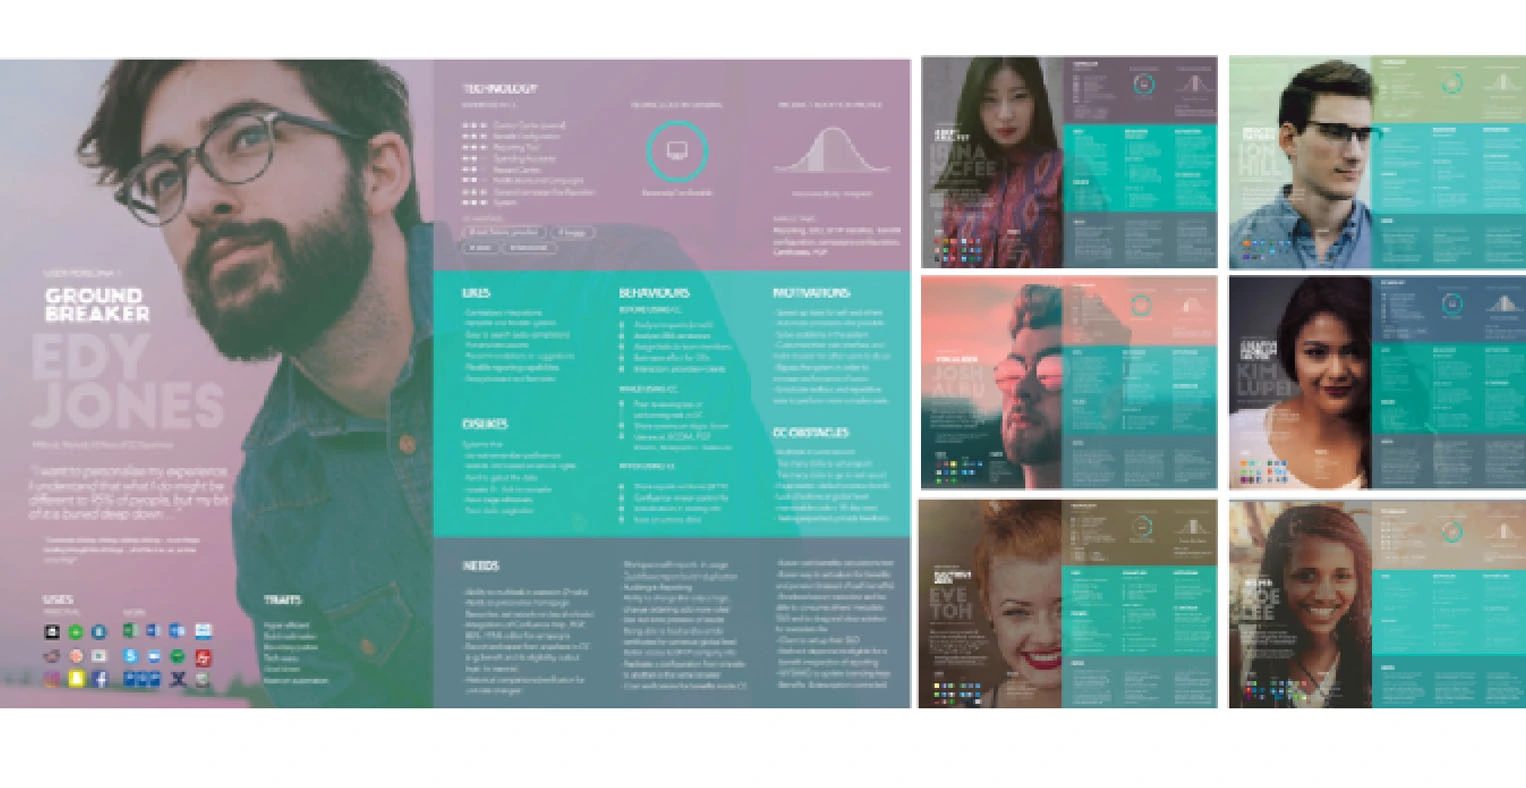
The final 7 personas, each detailing technology use, behaviours, needs, motivations and desires.
Affinity diagram
When I asked participants questions, they didn't always answer in the format I expected. Participants would describe a problem ("Control Centre has so much small content it puts too much stress on your eyes and brain"), a work-around they'd built to route around it ("I keep 5 tabs open at all times to compare employee, benefits and eligibility data"), a solution they wanted, or a piece of other software they admired. To extract the user need underneath each, I first categorised every insight into one of four types (problems, solutions, work-arounds and other technology), involving the product team in the exercise so the whole team stayed connected to the raw data rather than a summarised version of it.
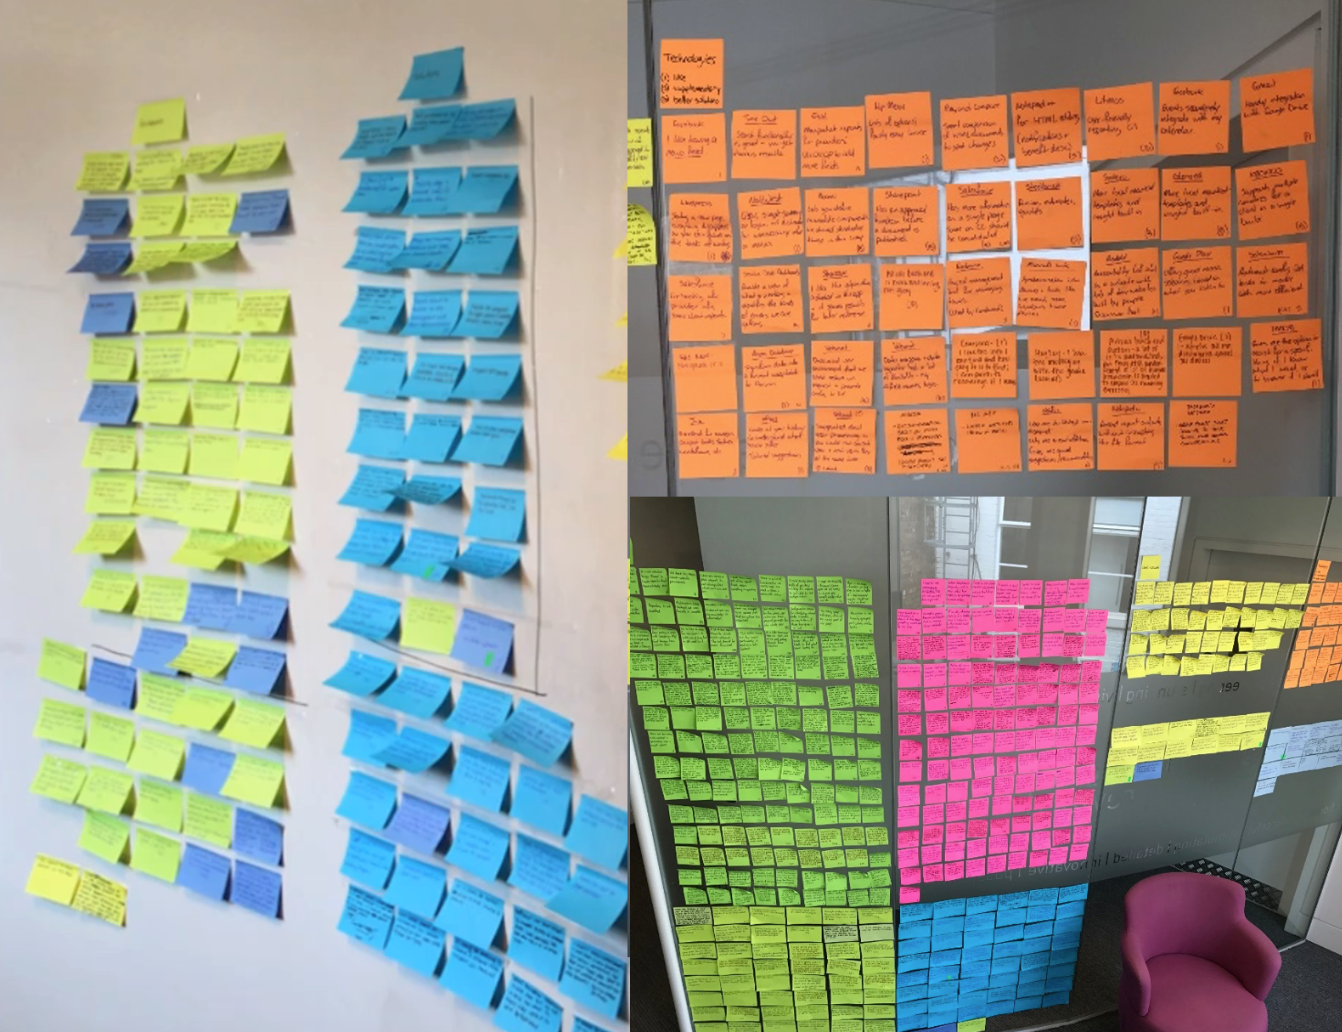
Phase 1: over 1,000 individual insights colour-coded as problems, solutions, technologies and work-arounds.
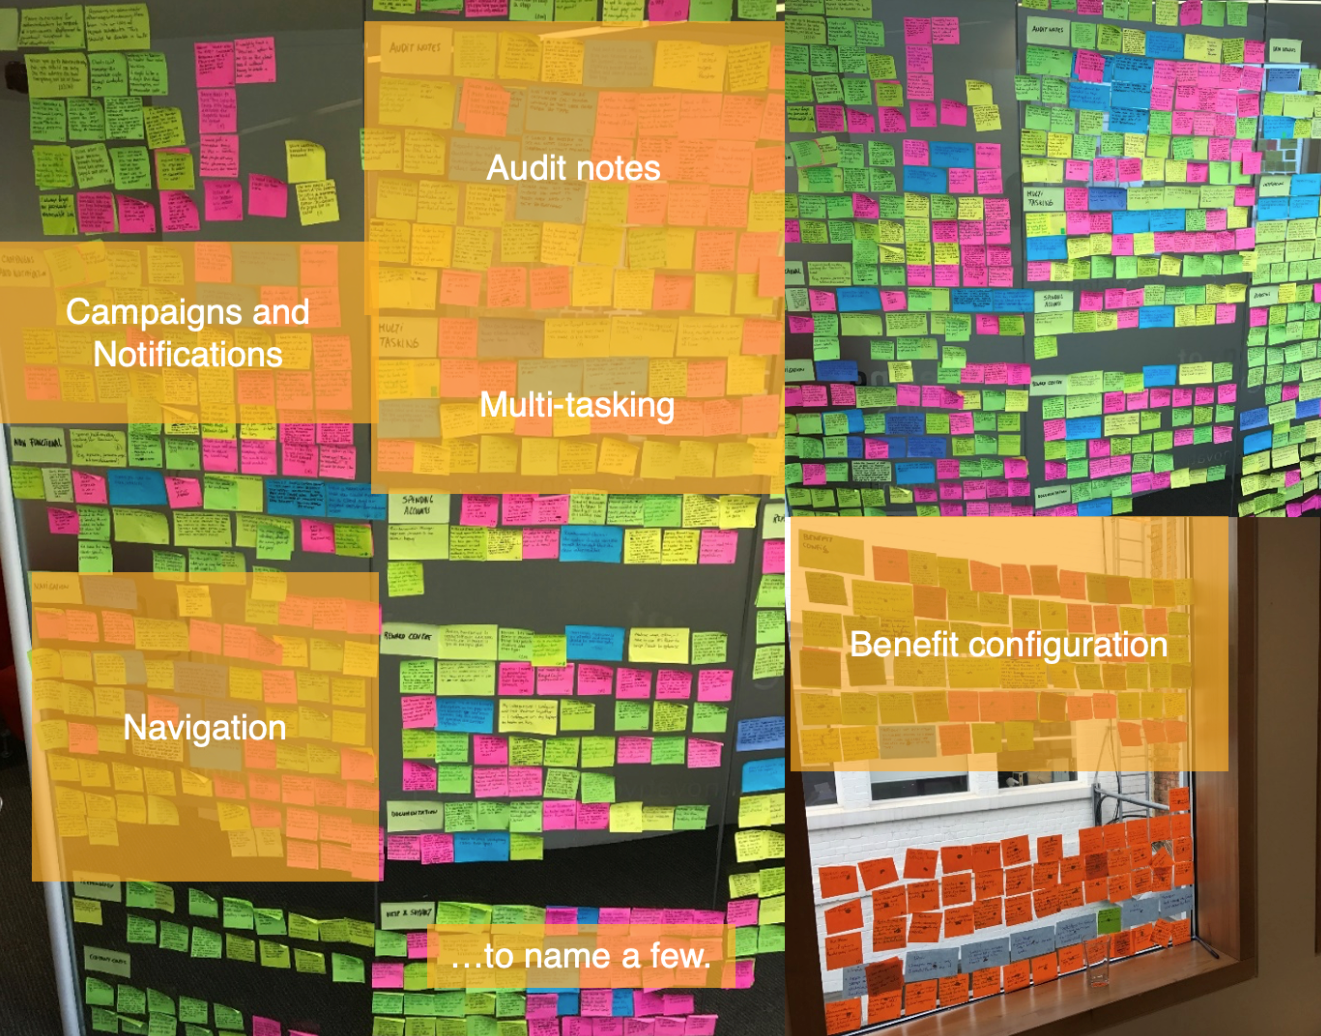
Phase 2: insights regrouped by functional area: audit notes, campaigns and notifications, multi-tasking, navigation, benefit configuration, and more.
With over 1,000 insights tagged, we regrouped them a second time by functional area of the platform (navigation, multi-tasking, audit notes, campaigns and notifications, benefit configuration, among others), so we could see problems, work-arounds and solution requests for the same area side by side. Overlapping a recurring problem with its work-around, its requested solution and any comparable feature from other software pointed to a single underlying user need, which we then translated into a user story.
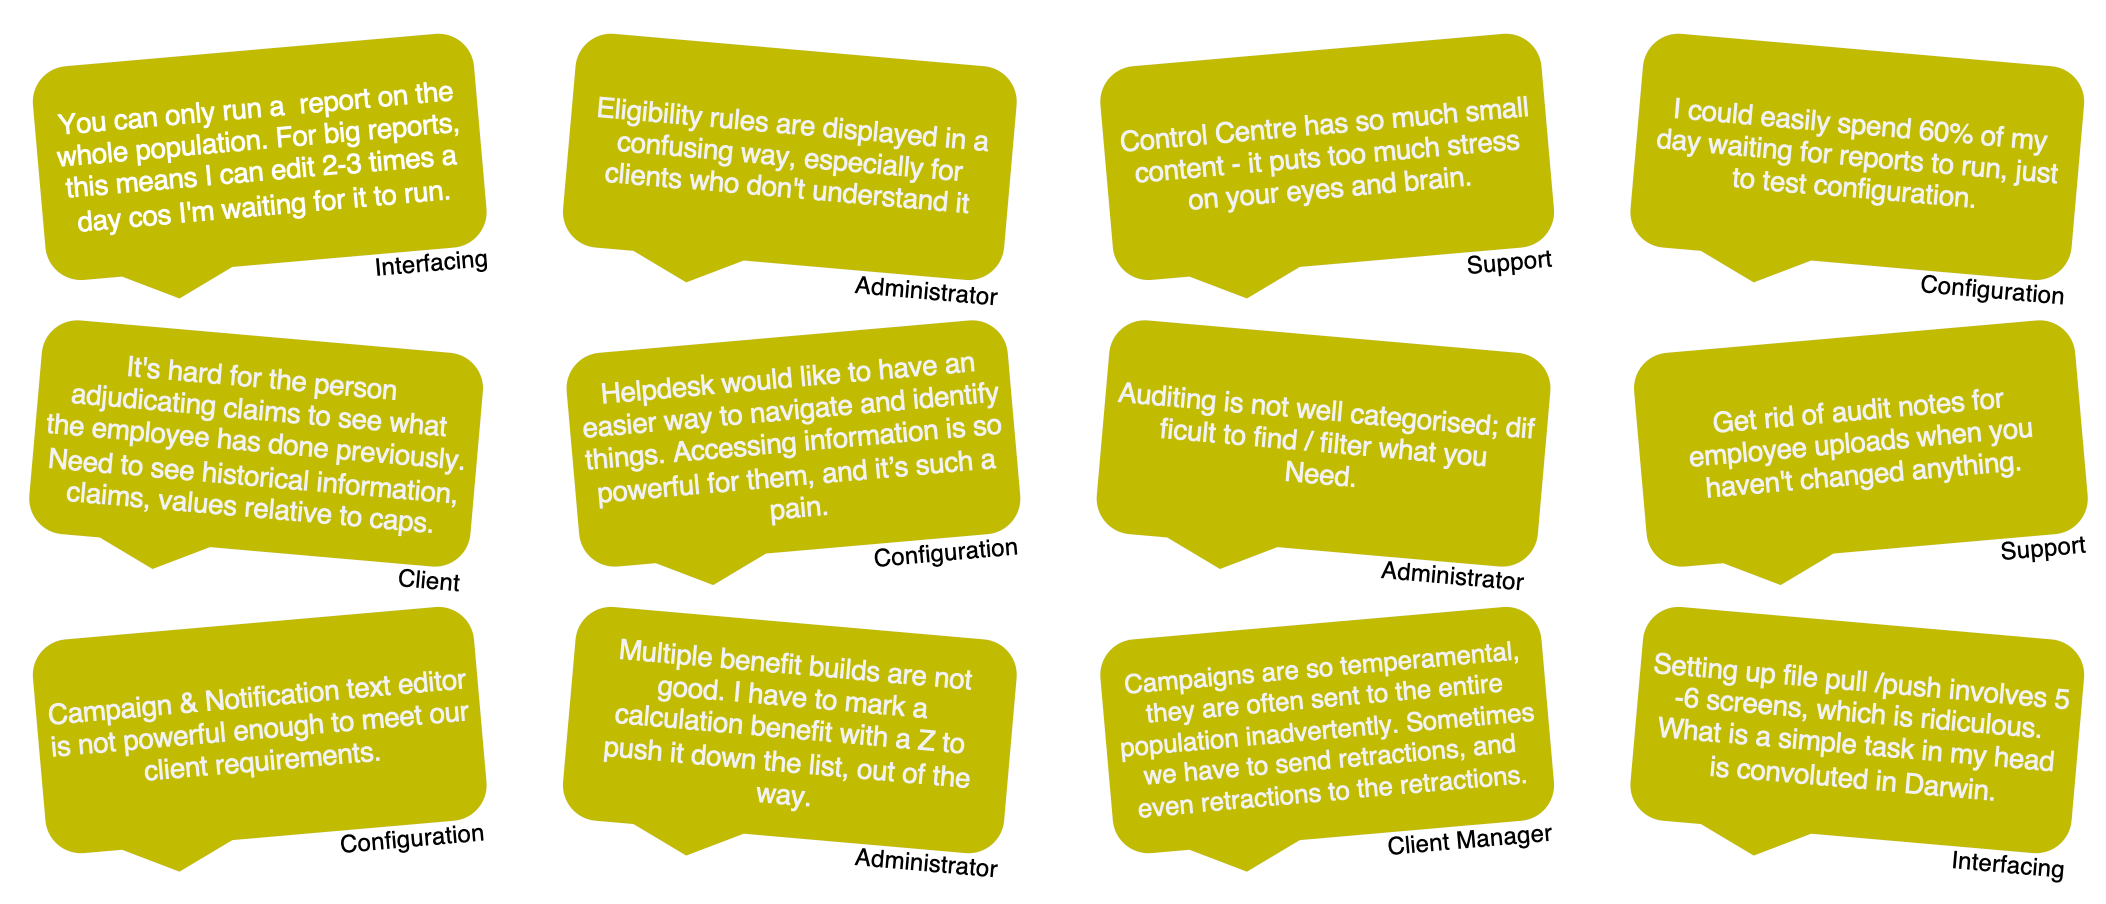
Examples of problems listed by participants.
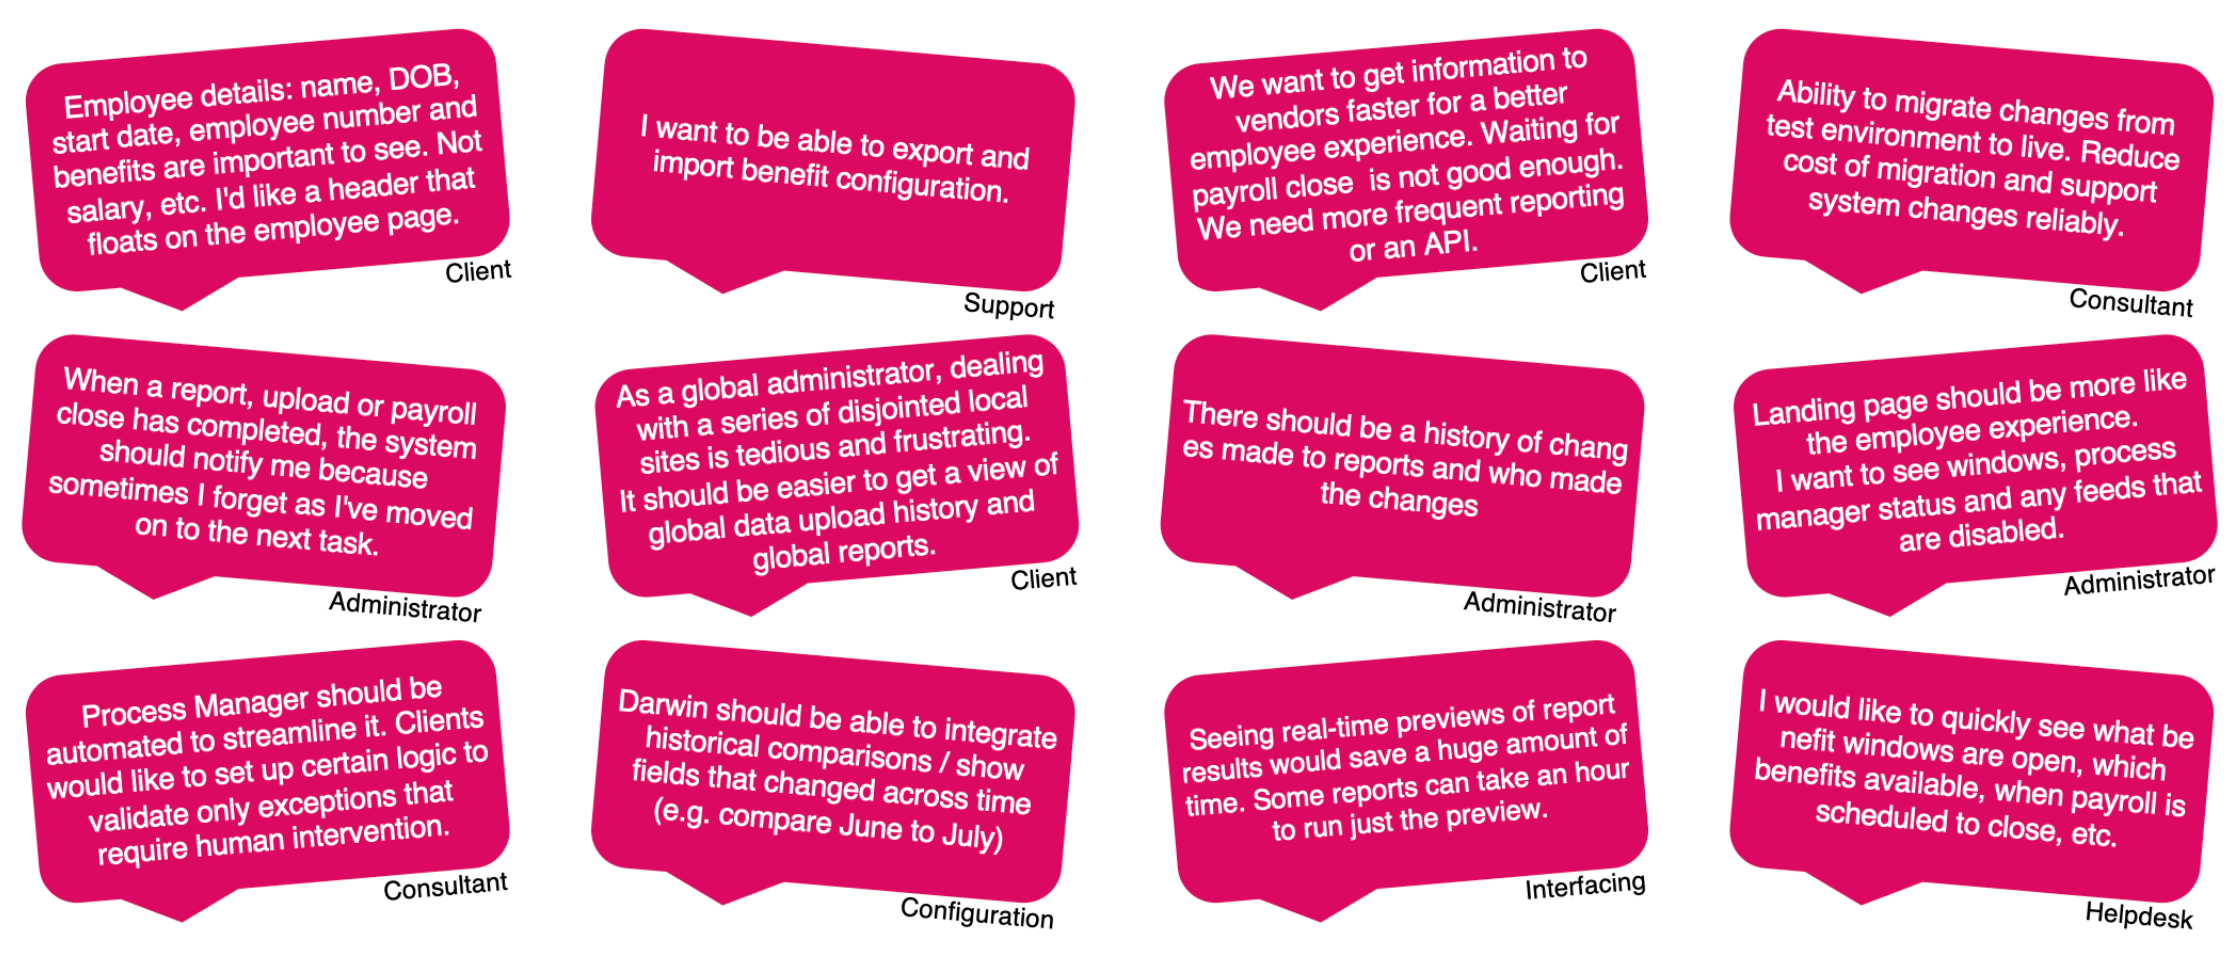
Examples of solutions suggested by participants.
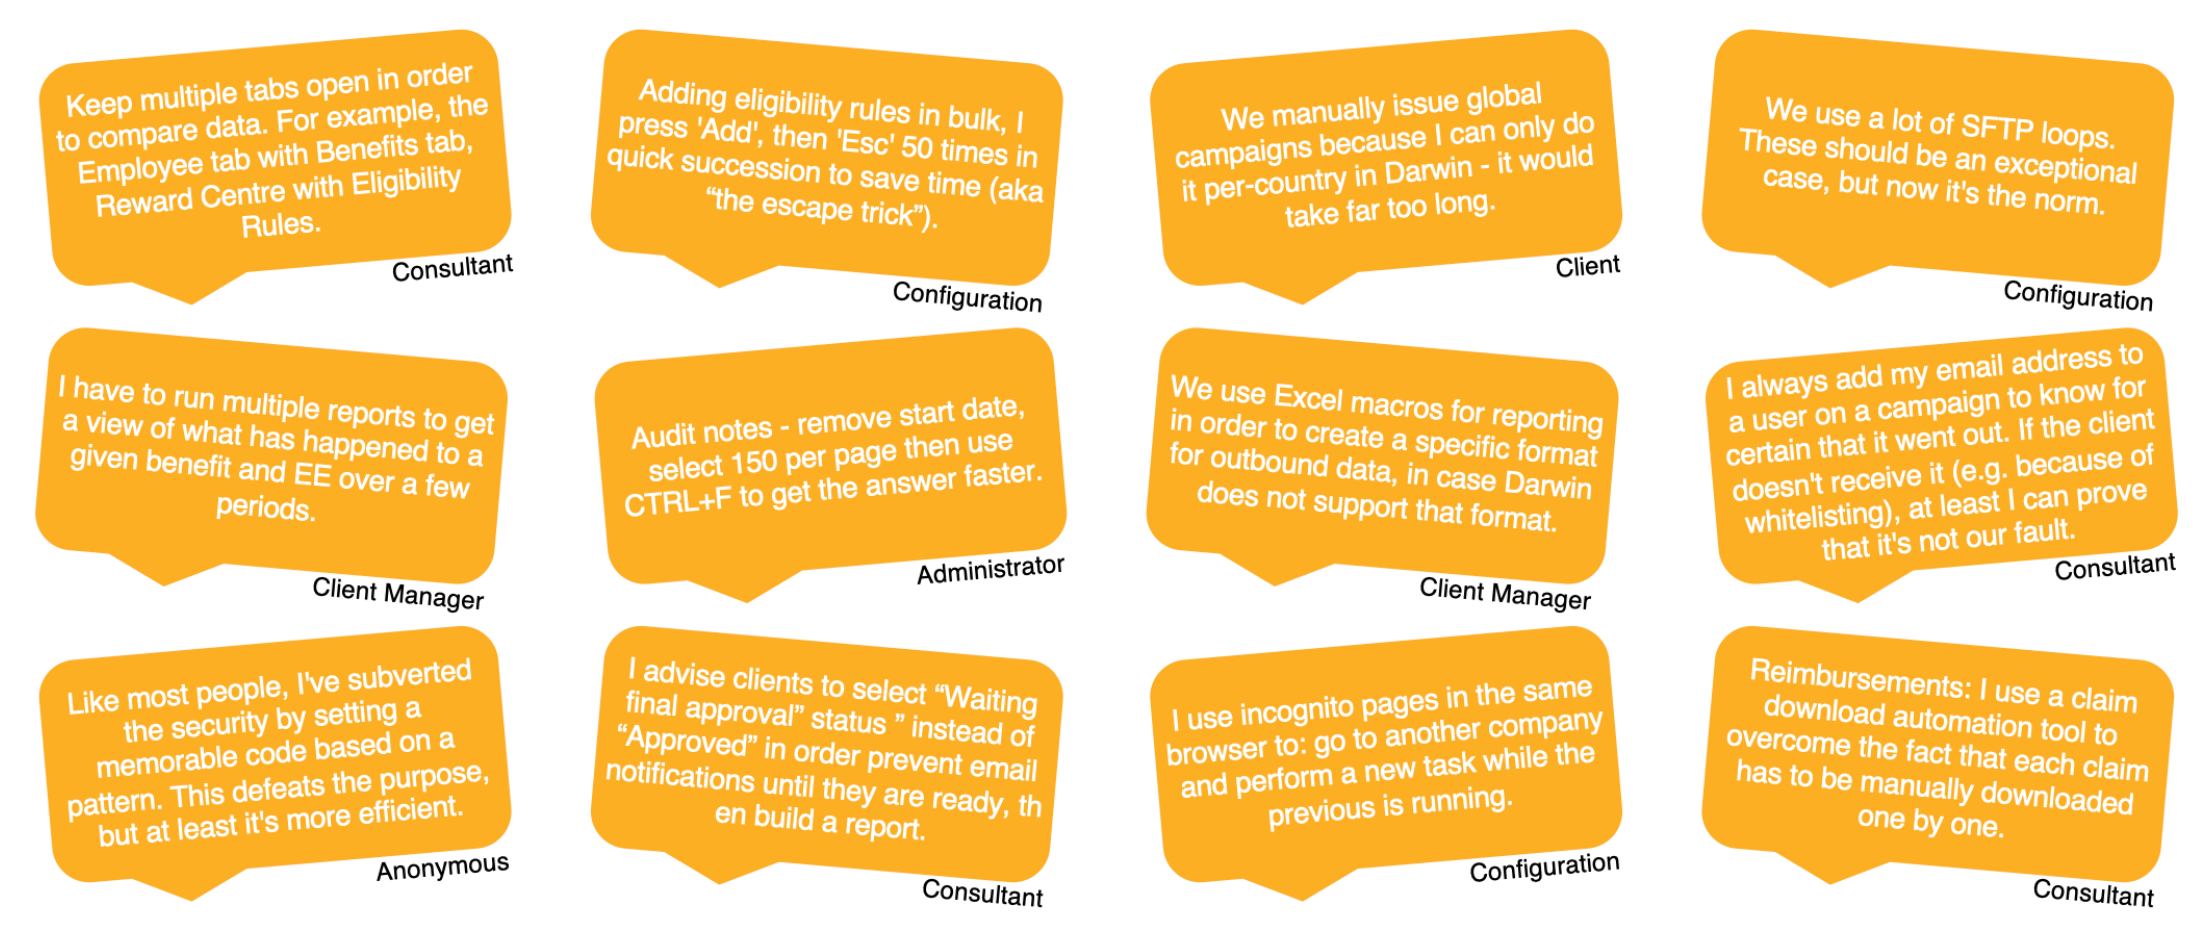
Examples of workarounds used by participants to bypass the software obstacles.
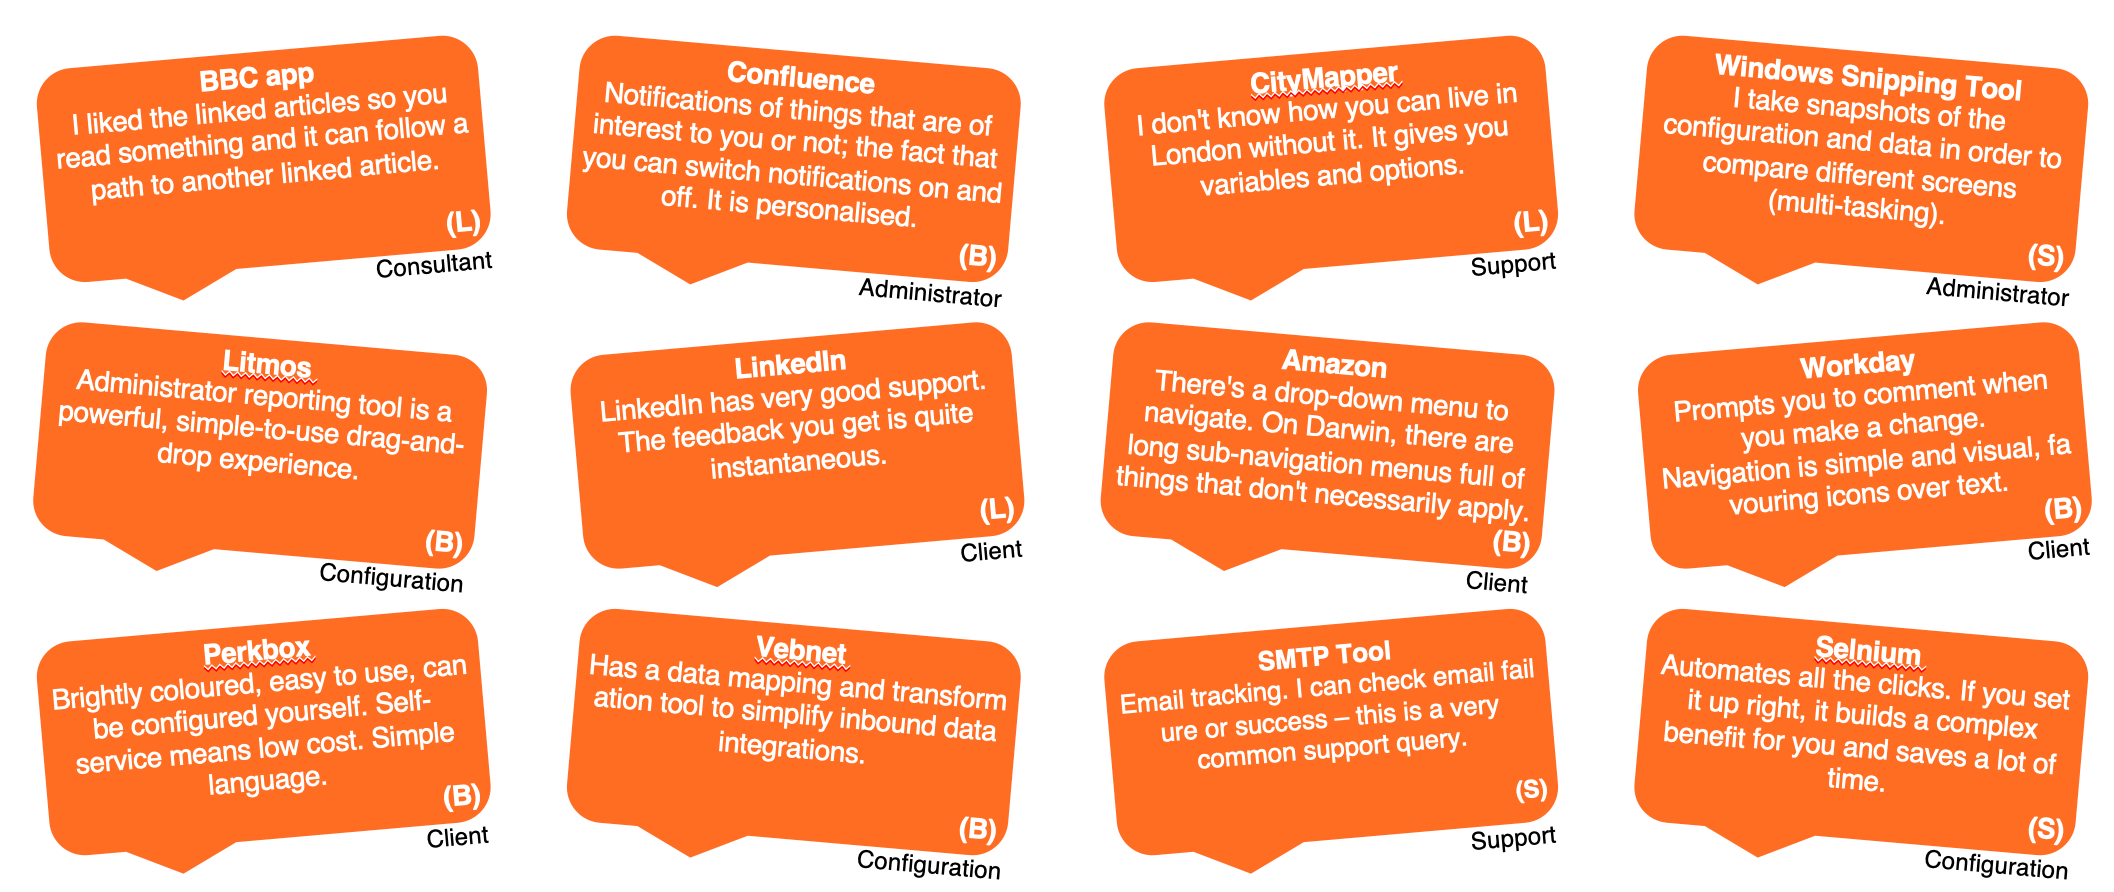
Examples of software participants liked to use.
User stories
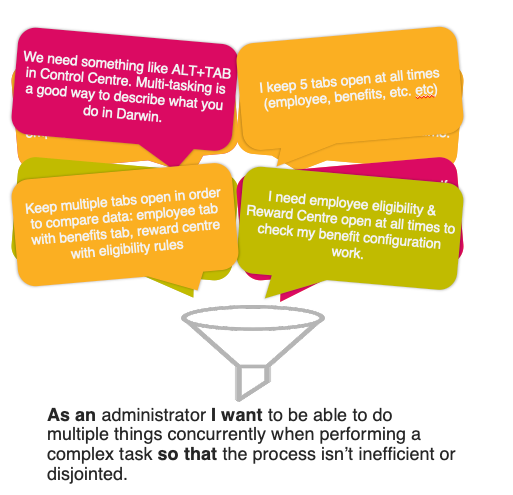
Verbatims funnelled into a single user story: natural-language requirements narrating the user's need and goal, not a system feature.
For each functional area, we funnelled the related problem, work-around and solution verbatims (e.g. wanting an "ALT+TAB for Control Centre", keeping multiple tabs open to cross-reference employee, benefits and eligibility data, and needing both eligibility rules and the reward centre open at once) down into one requirement, written as: As an administrator I want to be able to do multiple things concurrently when performing a complex task so that the process isn't inefficient or disjointed.
Writing requirements this way kept the conversation focused on the user's need rather than a specific feature, and made it easy to check the team's understanding against the raw data. We ran multiple exercises between product and UX to write these stories, inviting the owner of each subsection of the software so everyone was aligned on direction for each section, then shared them in a public repository for review before they were carried over as requirements into the JIRA stories created for the post-research activities.
Card sorting

Closed card sorting activity.
Many of the insights uncovered in the research were related to the navigation of the platform, so we included a card sorting activity as part of the generative research phase. Once the insights were synthesised, we were able to define the major categories of features to be included and iterated on within the software.
- We ran a closed card sorting activity with 2 groups, providing them with the main categories and features to group.
- Each group had time to discuss amongst themselves the reasoning behind their grouping.
- We then asked each group to walk us through their proposal, and compared the main similarities and differences across groups.
This laid the foundations for the information architecture map designed after this phase.
Results & Business Impact
Results & Business Impact
A shared, research-backed foundation for the redesign roadmap.
This research phase distilled 1,000+ insights from 60+ participants across 4 geographies into a clear understanding of our users, spanning specialisms and profile types, internal users, external clients and partners. It defined who we were designing for, what needed to be designed, and set the foundations for ideation, prototyping, testing and delivery.
Insights synthesised into user stories and personas.
Data-driven personas, one per user archetype.
Participants researched across 4 countries.
User stories became the brief
The user stories shaped the structure of the briefs for the co-creation workshops that followed, where the first concepts were generated, and informed the definition of user journeys based on dependency of needs. They also guided the hypotheses defined during the subsequent testing planning phases, and informed the roadmap for feature planning.
Personas replaced assumptions
Personas enabled everyone in the project to share an understanding of who the users were, based on objective research. They made discussions about the experience more productive, holding a clear vision of user needs and behaviours instead of starting from non-validated assumptions.
"User stories gave every subsection owner a shared brief, translating a thousand scattered insights into requirements the whole team could build against."
"Card sorting turned scattered navigation complaints into a structural map, and gave us a reusable page template system instead of a one-off fix."
"Personas gave everyone in the room the same evidence-backed picture of who we were designing for, instead of starting from assumptions."
Phased delivery by profile
The personas helped us prioritise features by targeted profile: for an MVP, that meant deciding which persona to design for first, e.g. the "cautious user" who needs step-by-step guidance, vs. the "groundbreaker" who needs advanced controls like shortcuts, leaving those for later iterations.
User stories shaped the roadmap
The user stories informed the roadmap for feature planning and were carried over directly as requirements into the JIRA stories created for the planned post-research activities.
Card sorting shaped the IA
The outputs of the card sorting set the foundations for the information architecture tree that redefined the navigation, providing a structural foundation for the navigation system we later translated into a reusable set of templates and pages that streamlined how pages were built.